

A/B Testing: Why do different sample size calculators and testing platforms produce different estimates of statistical significance?
A/B testing is a powerful way to increase conversion (e.g., 638% more leads, 78% more conversion on a product page, etc.).
Its strength lies in its predictive ability. When you implement the alternate version suggested by the test, your conversion funnel actually performs the way the test indicated that it would.
To help determine that, you want to ensure you’re running valid tests. And before you decide to implement related changes, you want to ensure your test is conclusive and not just a result of random chance. One important element of a conclusive test is that the results show a statistically significant difference between the control and the treatment.
Many platforms will include something like a “statistical significance status” with your results to help you determine this. There are also several sample size calculators available online, and different calculators may suggest you need different sample sizes for your test.
But what do those numbers really mean? We’ll explore that topic in this MarketingExperiments article.
A word of caution for marketing and advertising creatives: This article includes several paragraphs that talk about statistics in a mathy way — and even contains a mathematical equation (in case these may pose a trigger risk for you). Even so, we’ve done our best to use them only where they serve to clarify rather than complicate.
Why does statistical significance matter?
To set the stage for talking about sample size and statistical significance, it’s worth mentioning a few words about the nature and purpose of testing (aka inferential experimentation) and the nomenclature we’ll use.
We test in order to infer some important characteristics about a whole population by observing a small subset of members from the population called a “Sample.”
MECLABS metatheory dubs a test that successfully accomplishes this purpose a “Useful” test.
The Usefulness (predictiveness) of a test is affected by two key features: “Validity” and “Conclusiveness.”
Statistical significance is one factor that helps to determine if a test is useful. A useful test is one that can be trusted to accurately reflect how the “system” will perform under real-world conditions.
Having an insufficient sample size presents a validity threat known as Sample Distortion Effect. This is a danger because if you don’t get a large enough sample size, any apparent performance differences may have been due to random variation and not true insights into your customers’ behavior. This could give you false confidence that a landing page change that you tested will improve your results if you implement it, when it actually won’t.
“Seemingly unlikely things DO sometimes happen, purely ‘by coincidence’ (aka due to random variation). Statistical methods help us to distinguish between valuable insights and worthless superstitions,” said Bob Kemper, Executive Director, Infrastructure Support Services at MECLABS Institute.
“By our very nature, humans are instinctively programmed to seek out and recognize patterns: think ‘Hmm, did you notice that the last five people who ate those purplish berries down by the river died the next day?’” he said.
A conclusive test is a valid test (There are other validity threats in addition to sample distortion effect.) that has reached a desired Level of Confidence, or LoC (95% is the most commonly used standard).
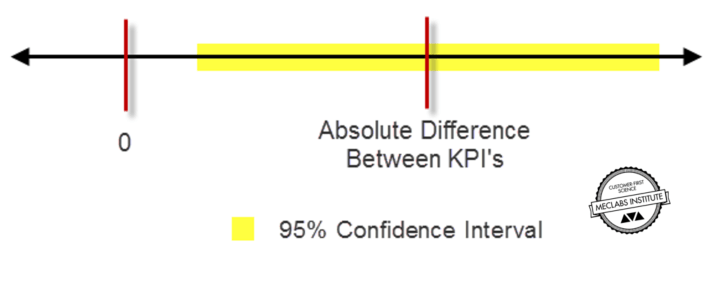
In practice, at 95% LoC, the 95% confidence interval for the difference between control and treatment rates of the key performance indicator (KPI) does not include zero.
A simple way to think of this is that a conclusive test means you are 95% confident the treatment will perform at least as well as the control on the primary KPI. So the performance you’ll actually get, once it’s in production for all traffic, will be somewhere inside the Confidence Interval (shown in yellow above). Determining level of confidence requires some math.
Why do different testing platforms and related tools offer such disparate estimates of required sample size?
One of MECLABS Institute’s Research Partners who is president of an internet company recently asked our analysts about this topic. His team found a sample size calculator tool online from a reputable company and noticed how different its estimate of minimum sample size was compared to the internal tool MECLABS analysts use when working with Research Partners (MECLABS is the parent research organization of MarketingExperiments).
The simple answer is that the two tools approach the estimation problem using different assumptions and statistical models, much the way there are several competing models for predicting the path of hurricanes and tropical storms.
Living in Jacksonville, Florida, an area that is often under hurricane threats, I can tell you there’s been much debate over which among the several competing models is most accurate (and now there’s even a newer, Next Gen model). Similarly, there is debate in the optimization testing world about which statistical models are best.
The goal of this article isn’t to take sides, just to give you a closer look at why different tools produce different estimates. Not because the math is “wrong” in any of them, they simply employ different approaches.
“While the underlying philosophies supporting each differ, and they approach empirical inference in subtly different ways, both can be used profitably in marketing experimentation,” said Danitza Dragovic, Digital Optimization Specialist at MECLABS Institute.
In this case, in seeking to understand the business implications of test duration and confidence in results, it was understandably confusing for our Research Partner to see different sample size calculations based upon the tool used. It wasn’t clear that a pre-determined sample size is fundamental to testing in some calculations, while other platforms ultimately determine test results irrespective of pre-determined sample sizes, using prior probabilities assigned by the platform, and provide sample size calculators simply as a planning tool.
Let’s take a closer look at each …
Classical statistics
The MECLABS Test Protocol employs a group of statistical methods based on the “Z-test,” arising from “classical statistics” principles that adopt a Frequentist approach, which makes predictions using only data from the current experiment.
With this method, recent traffic and performance levels are used to compute a single fixed minimum sample size before launching the test. Status checks are made to detect any potential test setup or instrumentation problems, but LoC (level of confidence) is not computed until the test has reached the pre-established minimum sample size.
While historically the most commonly used for scientific and academic experimental research for the last century, this classical approach is now being met by theoretical and practical competition from tools that use (or incorporate) a different statistical school of thought based upon the principles of Bayesian probability theory. Though Bayesian theory is far from new (Thomas Bayes proposed its foundations more than 250 years ago), its practical application for real-time optimization research required computational speed and capacity only recently available.
Breaking Tradition: Toward optimization breakthroughs
“Among the criticisms of the traditional frequentist approach has been its counterintuitive ‘negative inference’ approach and thought process, accompanied by a correspondingly ‘backwards’ nomenclature. For instance, you don’t ‘prove your hypothesis’ (like normal people), but instead you ‘fail to reject your Null hypothesis’ — I mean, who talks (or thinks) like that?” Kemper said.
He continued, “While Bayesian probability is not without its own weird lexical contrivances (Can you say ‘posterior predictive’?), its inferential frame of reference is more consistent with the way most people naturally think, like assigning the ’probability of a hypothesis being True’ based on your past experience with such things. For a purist Frequentist, it’s impolite (indeed sacrilegious) to go into a test with a preconceived ‘favorite’ or ‘preferred answer.’ One must simply objectively conduct the test and ‘see what the data says.’ As a consequence, the statement of the findings from a typical Bayesian test — i.e., a Bayesian inference — is much more satisfying to a non-specialist in science or statistics than is an equivalent traditional/frequentist one.”
Hybrid approaches
Some platforms use a sequential likelihood ratio test that combines a Frequentist approach with a Bayesian approach. The adjective “sequential” refers to the approach’s continual recalculation of the minimum sample size for sufficiency as new data arrives, with the goal of minimizing the likelihood of a false positive arising from stopping data collection too soon.
Although an online test estimator using this method may give a rough sample size, this method was specifically designed to avoid having to rely on a predetermined sample size, or predetermined minimum effect size. Instead, the test is monitored, and the tool indicates at what point you can be confident in the results.
In many cases, this approach may result in shorter tests due to unexpectedly high effect sizes. But when tools employ proprietary methodologies, the way that minimum sample size is ultimately determined may be opaque to the marketer.
CONSIDERATIONS FOR EACH OF THESE APPROACHES
Classical “static” approaches
Classical statistical tests, such as Z-tests, are the de facto standard across a broad spectrum of industries and disciplines, including academia. They arise from the concepts of normal distribution (think bell curve) and probability theory described by mathematicians Abraham de Moivre and Carl Friedrich Gauss in the 17th to 19th centuries. (Normal distribution is also known as Gaussian distribution.) Z-tests are commonly used in medical and social science research.
They require you to estimate the minimum detectable effect-size before launching the test and then refrain from “peeking at” Level of Confidence until the corresponding minimum sample size is reached. For example, the MECLABS Sample Size Estimation Tool used with Research Partners requires that our analysts make pre-test estimates of:
- The projected success rate — for example, conversion rate, clickthrough rate (CTR), etc.
- The minimum relative difference you wish to detect — bigger differences are easier to detect but harder to effect. In other words, it is easier to mathematically determine that A is different than B when there is a 50% difference in performance than when there is a 2% difference, but it is far easier to generate a 2% increase in conversion than it is to generate a 50% increase
- The statistical significance level — this is the probability of accidentally concluding there is a difference due to sampling error when really there is no difference (aka Type-I error). MECLABS recommends a five percent statistical significance which equates to a 95% desired Level of Confidence (LoC).
- The arrival rate in terms of total arrivals per day — this would be your total estimated traffic level if you’re testing landing pages. “For example, if the element being tested is a page in your ecommerce lower funnel (shopping cart), then the ‘arrival rate’ would be the total number of visitors who click the ‘My Cart’ or ‘Buy Now’ button, entering the shopping cart section of the sales funnel and who will experience either the control or an experimental treatment of your test,” Kemper said.
- The number of primary treatments — for example, this would be two if you’re running an A/B test with a control and one experimental treatment.
Typically, analysts draw upon a forensic data analysis conducted at the outset combined with test results measured throughout the Research Partnership to arrive at these inputs.
“Dynamic” approaches
Dynamic, or “adaptive” sampling approaches, such as the sequential likelihood ratio test, have been theoretically possible for quite some time but have become a practical tool more recently thanks in large part to the fact that sufficient access to significant computing and real-time measuring abilities have become more readily available to marketers.
Because adaptive sampling employs frequent computational reassessment of sample size sufficiency and may even be adjusting the balance of incoming traffic among treatments, they were impractical until they could be hosted on machines with the computing capacity to keep up.
One potential benefit can be shortened test duration since the effect size for an A/B test is difficult to estimate accurately beforehand, which is required in a Frequentist approach.
This is where prior data is so important to this approach. The model can shorten test duration specifically because it takes prior data into account. An attendant limitation is that it can be difficult to identify what prior data is used and exactly how statistical significance is calculated. This doesn’t necessarily make the math any less sound or valid, it just makes it somewhat less transparent. And the quality/applicability of the priors can be critical to the accuracy of the outcome.
As Georgi Z. Georgiev explains in Issues with Current Bayesian Approaches to A/B Testing in Conversion Rate Optimization, “An end user would be left to wonder: what prior exactly is used in the calculations? Does it concentrate probability mass around a certain point? How informative exactly is it and what weight does it have over the observed data from a particular test? How robust with regards to the data and the resulting posterior is it? Without answers to these and other questions an end user might have a hard time interpreting results.”
As with other things unique to a specific platform, it also impinges on the portability of the data, as Georgiev explains:
A practitioner who wants to do that [compare results of different tests run on different platforms] will find himself in a situation where it cannot really be done, since a test ran on one platform and ended with a given value of a statistic of interest cannot be compared to another test with the same value of a statistic of interest ran on another platform, due to the different priors involved. This makes sharing of knowledge between practitioners of such platforms significantly more difficult, if not impossible since the priors might not be known to the user.
Interpreting MECLABS (classical approach) test duration estimates
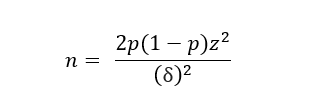
At MECLABS, the estimated minimum required sample size for most experiments conducted with Research Partners is calculated using classical statistics. For example, the formula for computing the number of samples needed for two proportions that are evenly split (uneven splits use a different and slightly more complicated formula) is provided by: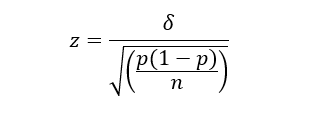
Solving for n yields:
Variables:
- n: the minimum number of samples required per treatment
- z: the Z statistic value corresponding with the desired Level of Confidence
- p: the pooled success proportion — a value between 0 – 1 — (i.e., of clicks, conversions, etc.)
- δ: the difference of success proportions among the treatments
This formula is used for tests that have an even split among treatments.
Once “samples per treatment” (n) has been calculated, it is multiplied by the number of primary treatments being tested to estimate the minimum number of total samples required to detect the specified amount of “treatment effect” (performance lift) with at least the specified Level of Confidence, presuming the selection of test subjects is random.
The estimated test duration, typically expressed in days, is then calculated by dividing the required total sample size by the expected average traffic level, expressed as visitors per day arriving at the test.
Finding your way
“As a marketer using experimentation to optimize your organization’s sales performance, you will find your own style and your own way to your destination,” Kemper said.
“Like travel, the path you choose depends on a variety of factors, including your skills, your priorities and your budget. Getting over the mountains, you might choose to climb, bike, drive or fly; and there are products and service providers who can assist you with each,” he advised.
Understanding sampling method and minimum required sample size will help you to choose the best path for your organization. This article is intended to provide a starting point. Take a look at the links to related articles below for further research on sample sizes in particular and testing in general.
You might also like …
17 charts and tools have helped capture more than $500 million in (carefully measured) test wins
MECLABS Institute Online Testing on-demand certification course
Marketing Optimization: How To Determine The Proper Sample Size
A/B Testing: Working With A Very Small Sample Size Is Difficult, But Not Impossible
A/B Testing: Split Tests Are Meaningless Without The Proper Sample Size
Two Factors that Affect the Validity of Your Test Estimation
Frequentist A/B test (good basic overview by Ethen Liu)
Bayesian vs Frequentist A/B Testing – What’s the Difference? (by Alex Birkett on ConversionXL)
Thinking about A/B Testing for Your Client? Read This First. (by Emīls Vēveris on Shopify)
On the scalability of statistical procedures: why the p-value bashers just don’t get it. (by Jeff Leek on SimplyStats)
Bayesian vs Frequentist Statistics (by Leonid Pekelis on Optimizely Blog)
Statistics for the Internet Age: The Story Behind Optimizely’s New Stats Engine (by Leonid Pekelis on Optimizely Blog)
Issues with Current Bayesian Approaches to A/B Testing in Conversion Rate Optimization (by Georgi Z. Georgiev on Analytics-Toolkit.com)