


In my job as a Senior Research Manager at MarketingExperiments, I talk to a lot of people who are new to online testing. Before I started, I used to think the most intimidating factor for newbies would be coming up with page designs and development. But it’s not. Dealing with metrics, by far, is the most intimidating.
Maybe it’s because, when they reached the fork in the road, they took the marketing path because they simply didn’t like math.
Or maybe metrics are intimidating simply because there are so many of them!
- Which metrics should I care most about?
- How do I interpret them?
- Which metrics should I install for my test?
I have some good news: You can eliminate all the confusion and anxiety you have if you organize your metrics into four major groups. And guess what? Specific groups (like Source and Nature) are far more important to planning great tests than others (like Amount and Result). Let me explain.
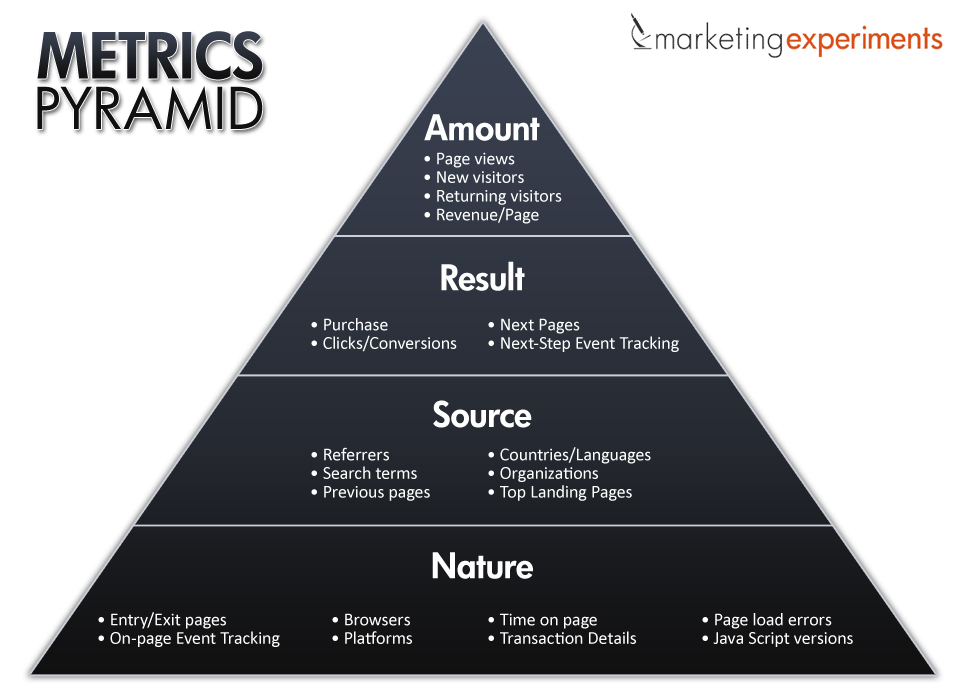
My Metrics Pyramid (it’s like the old Food Pyramid)
So let’s forget about numbers for just a moment. I put together an easy visual that functions a lot like the old Food pyramid. The metrics that need more emphasis to plan great tests are at the bottom and the metrics that need less are at the top.
For Example: Your most revealing metrics are Nature and Source and should be at the base of your testing strategy, just like the pyramid said more bread, vegetables, and fruit at the base of your diet. When it comes to fats, oils and sweets (the Amount and Result categories in this case), they could look and taste great but can end up giving you a stomachache you if you put too much emphasis on them just because it looks like it’s a great spot to test for an increase.
Group 1: Nature (the Why)
If you want to know what people are experiencing (or buying) on your pages, then look at this metric group. Common metrics that are a part of this group include:
- Event tracking
- Browsers/Platforms
- Time on page
- JavaScript versions
- Transaction Details
Use this group of metrics to find big problems people may be experiencing on your site. Just study the conversion rates for different operating systems. If there is a huge difference in conversion rate between Windows users and Safari users, and there is a large amount of visitors in the suffering system, then it’s possible that a simple fix can really move the needle.
Or even consider time on page or transaction details. How does it compare to other pages? Are people taking the time (on average) to read all your copy, or are they just buying a particular product and not others?
Group 2: Source (the Who)
If you want to know where people are coming from, then look at this metric group. Common metrics that are a part of this group include:
- Referrers
- Search terms
- Countries and Languages
- Top Landing Pages
These metrics often give clues to the motivation of your visitors and allow you to understand how many different types of visitors are coming to your pages. Many times my team has been able to look at search terms, or a referral site, and understand the kind of experience or content the visitor is expecting. A test that doesn’t take source metrics into consideration is a test that has no clear target.
You can know what resulting action you want visitors to take, but there is no way you can effectively influence them to take it without knowing where they are coming from and what expectations they have (from an experience OR content standpoint)
Group 3: Result (the What)
If you want to know what people do once they get to a page, then look at this metric group. Common metrics that are a part of this group include:
- Conversions/Purchases
- Clicks
- Next Pages/Requested Pages
These metrics are like mile markers on your highway to conversion. What markers must people take to get to the end of the road? At what markers do people get off the highway and get off track? If you can figure out what critical path visitors must take to impact your bottom line, you can determine where leaks are in your funnel (and start thinking about how to patch them).
If you see a great Amount of visitors that show a common Result action (like leaving the critical path in a certain direction), then you are at the beginnings of finding a good test to run. Still, though, you’ll need the help of group 2 and/or 1.
Group 4: Amount (the Where and When)
If you want to know what pages people are viewing, this is the metric group for you. Common metrics that are a part of this group include:
- Page views (unique, not unique)
- Visitors (new and returning)
- Visits
- Total Revenue
While you can’t build a test plan without considering this group, you shouldn’t build a test plan solely based on this group. I made this mistake once and it nearly cost me the confidence of my team. Just because there is a lot of traffic somewhere doesn’t mean it’s the right place to start.
Amount is the least important group of the four for building a better test plan.
Less sugar and fat, more substance
When the base of your test is built on better metrics, your results potential increases.

If you want to ensure that your test plan is most likely to get a gain (somewhere), then make sure you are using all four metrics groups to build your test plan and sequence. If you don’t have a lot of metrics in the Nature category, you can still plan a decent test with groups 2-4. Just stay away from an Amount- and Result-only diet.
Related Resources:
Copywriting: Long copy vs. short copy matrix
B2B Marketing Infographic: How are B2B marketers optimizing their funnel?
Great pyramid!
I may have to print this one out and post it on my wall as a constant reminder of what metrics to be looking at.
Good stuff 😉
Jeremy Reeves
http://www.JeremyReeves.com
Thanks, Jeremy! Always good to get feedback on these type of quick reference visuals 🙂
Great post. Marketers should print the pyramid graphic and pin it up as a reminder.
Hi Jon,
I’m on the FOT course, and watched your presentation about Metrics where you present the 4 categories. So I made a table with all metric types organized into categories and I have two questions:
Why is “Device” categorized as source but “browser/platform” is categorized as “Nature”?
Is it correct to categorize “OS” as “Nature”?
y the way, have you guys created such chart? If so It’d be great to get it.
Hey Hellie,
Jon no longer works here, so I’ll do my best to answer.
Right now, I can’t find where Jon references “device” or where it is categorized. Is there another post you are referencing or am I missing something? As for the chart, it should be just above this comments section. Is it not displaying for you?
Please let me know.
-Paul