In Part 2 of our series on bounce rates, we examined how to ensure consistency between your site and the links and ads that drive users there. But once they understand the connection between where they came from and where they are, is there a clear path for what they need to do next?
Sometimes we get so caught up in creating great-looking pages, killer headlines, and excellent copy that we neglect making sure there is a clearly understood goal for what the user needs to do next. It is our job to make the next step in the flow logical and clear so we help them make the intended decision.
Some people arrive at pages and find everything attractive and desirable but there is no clear next step, so they leave. Think of it as having a great infomercial about a knife set. After watching for a few minutes, I’m convinced I need knife that can cut pennies. To top it off, if I act now I can receive a second knife for free. Score, I’m in! However, the infomercial ends there. No phone number or website. I’m excited, I want these amazing knives, but don’t know what to do next. Due diligence with graphics, copy, headlines and other aspects of web pages accomplishes nothing if you are leaving your visitors hanging.
Every marketer I’ve worked with thinks this is pretty basic and they’re doing it already. If you’re nodding your head in agreement, here is my Thanksgiving challenge to you. After the turkey has been devoured, let Uncle Saul and your niece with the pink hair sit down and try to navigate your pages. The results, and their hang-ups, might surprise you.
Now, to address a couple of excellent questions I received about the first two posts in this series…
How do I look at bounce rate for specific blog post pages that have descriptive links that direct traffic directly to the post? – @SquidleyRidley
On social media and other channels, there are many links to single posts on a blog. For example, tweets with a link to a blog post. This can cause, as Squid points out (can I call you Squid?), a situation where people might be more likely to bounce because of the very targeted nature of the visit.
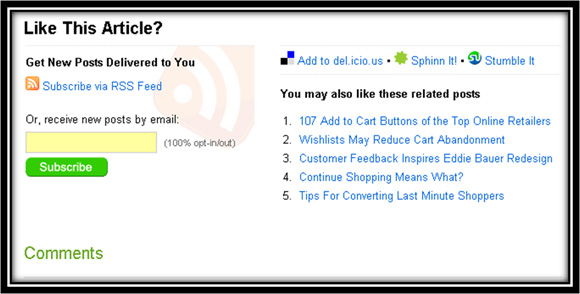
However, as markers and content managers, it is our job to create an engaging experience. A good related post section at the end of each post, and perhaps in the navigation as well, can greatly improve engagement. Here is an example from GetElastic, a blog by Linda Bustos. Note how she engages users with related links at the end of her blog posts:
Just installing a plug-in to generate these related post links might return poor results, so this may require some manual work on your end. Automated systems have come a long way, but sometimes a human mind is needed in building a useful list.
Google is the most fantastic software on the planet. How else can we use Google Analytics to arrive at more intelligent bounce rate reporting? – Sergey, Larry and Eric
For the sake of space, I edited several questions I commonly hear about metrics into the above question and attributed it to three random people from Mountain View, California.
Avinash Kaushik and other metrics evangelists believe that a true measure of bounce rate is not the relationship with navigation, but rather time. While the exact number is different depending on the source, most believe that after a visitor is on the site longer than six to ten seconds they are no longer a bounce even if they never click to another page.
According to the Padicode blog, you can use event tracking in Google Analytics to generate a report that shows visitors that stay for less than ten seconds (or whatever time period you designate). The following code line should be added under the pageTracker._trackPageview(); line:
setTimeout(‘pageTracker._trackEvent(\’NoBounce\’, \’NoBounce\’, \’Over 10 seconds\’)’,10000);
In the code, please note the 10000. This number is in milliseconds, so it equals ten seconds. Your report now shows an appended bounce rate of users that meet these criteria. This is not retroactive, so data will take a while.
Corey, you speak in generalities. We want something specific. What number should we be looking for? – Sergey, Larry, and Eric
It depends.
Thanks for reading this series on bounce rates. I hope all my American readers have a great Thanksgiving, and readers in the rest of the world enjoy a fantastic Thursday.
OK, I’m back. I can’t leave you hanging like that. I know you want a number, but I just can’t give it to you. I received many questions about this (and thanks to Sergey, Larry, and Eric for serving as a concrete representation of all those questioners), but there is no one right answer.
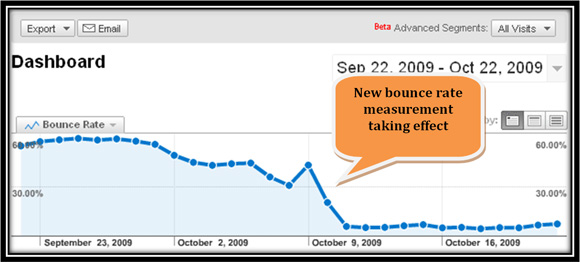
For certain pages/process, you have a tighter leash on traffic and should have a lower bounce rate than others. For example, homepages receive traffic from a vast array of sources, thus something in the 40-60% range would be acceptable. If you are using the above analytics tip and are thus measuring time spent, a much lower bounce rate should be the threshold.
For PPC landing pages, that number should be lower – in the 30-40% range. And ideally lower than that if you have a tight rein on your keywords and a healthy account structure with negative keywords. Again, if you’re using the above altered bounce rate reporting to measure time spent, even lower numbers should be expected.
Now that I’ve got you excited about bounce rates…
There is a point of diminishing returns with bounce rate, as there is with focusing too much on any one metric. In an attempt to squeeze incremental bounce rate improvements, you have to ask if your time spent is better spent elsewhere. For example, improving your product or offer, formulating strategic partnerships, observing changes in your competitive landscape, and so on. It is very easy to become a tad obsessive (I am currently recovering and a member of Web Analytics Anonymous as well) and we end up robbing precious brainpower that we can devote to other items.
I hope this three-part series on bounce rates proved useful and helps you gain a greater return from your pages. Make sure you perform due diligence to accurately measure bounce rates, understand why bounces happen, and test to lower that number by providing more engaging pages/process. Then let things cool for a bit and return at a later time with a fresh set of eyes.
What metric would you like us to address next? Leave a comment below about your measurement challenges and we will try to address them on future blog posts or in upcoming web clinics.


That tip about eliminating the bounces from people who stay for some time but leave from the same page, is very well taken. Thanks Corey!
Future article idea:
I think being able to identify the 404 errors, recover from them gracefully (like showing a page with links to similar content and home page) and redirect the links when the page has been knowingly removed is very vital for retaining traffic that comes in but does not result in business.
Traffic Saved, Traffic Gained 🙂
Arun
I think people tend to love bounce rate cause it is one of the very few accessible actionable metric… well, just mroe actionable than others 🙂
However, you are right… focusing only on one metric doesn’t help that much. 🙂
Looking at a report on bounce rate for different keywords or ad campaigns could really be useful though 🙂
Happy Thanksgiving.
@ARun
You are welcome for the tip. I would encourage the read on Padicode’s blog, as they do a great job of walking through the process.
I like the idea of the 404 pages and will think about how to accomplish this. However, the goal being to minimize 404’s as much as we can 🙂
@Claudiu
I am not sure I follow how bounce rate is one of the few accessible actionable metrics. I find that there is a great number of actionable metrics especially given the breath of reporting free tools are offering. For example, looking at where people are exiting on your site, how different traffic sources (as you pointed out perform), navigation summaries, funnel/goal performance, how many fields do users get on your forms, and the list goes on.
Also, if people are not making actions on your metrics, what is the point of measurement?
You make an excellent point in looking at metrics in segments to pull the most valuable information out of them. Just looking at the 60,000ft view can lead to us making very wrong assumptions. Great point!
Have a great Thanksgiving as well.
Thanks to you both for the great feedback.