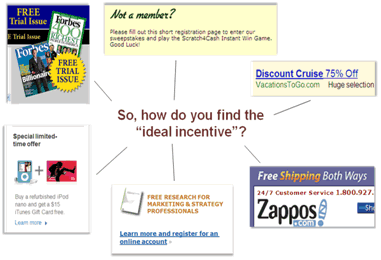
The right incentive can make a significant impact on response rates, whether it’s used to build lists and generate leads or increase online sales.
But how do you determine which incentive will overcome friction best and deliver maximum return?
And which common errors should you avoid?
Even if a site or page has been 100% optimized for several factors, adding the “ideal incentive” can substantially improve results.
This brief will examine how to find the ideal incentive, and not just for the purposes of email capture.
Editor’s Note: We recently released the audio recording of our clinic on this topic. You can listen to a recording of this clinic here:
Finding the Ideal Incentive: How We Increased Email Capture by 319%
Incentive: An appealing element—a component of value—introduced in your process to achieve a desired action.
Examples of incentives:
- Free White Paper or E–Book
- Product Discount
- Gift
- Free Shipping
- Complementary Product or Accessory
- Chance for a Prize
Our research has shown that by consistently applying the elements in the MarketingExperiments Conversion Index (above), substantial increases in conversion can be achieved.
This brief will “drill down” on the ‘i’ in the index, representing Incentive. Incentive is used to counter the element of Friction, which is always present in the conversion process.
Editor’s Note: The MarketingExperiments’ Landing Page Optimization Certification Course examines the index in detail.
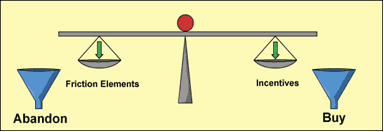
The objective of an incentive is to “tip the balance” of emotional forces from negative (exerted by Friction elements) to positive in the mind of a visitor.
The right incentive will have a significant impact on conversion.
Case Study 1: Test Design
We conducted a 22–day test for a computer products retailer to determine the difference between the perceived value of two quality incentives.
An email capture pop–up offered a sweepstakes entry form. The “prize” was either a cordless keyboard and mouse or a portable MP3 player.
Challenge: To increase email capture through a sweepstakes.
Objective: To determine the more effective incentive.
Which incentive do you think performed better in our test?
Results

What you need to understand: The keyboard and mouse outperformed the MP3 player and increased email capture by 319% (5.71% vs. 1.79%). The keyboard and mouse incentive had a higher Perceived Value.
Visitors’ perception of the two incentives’ quality and familiarity with comparable products in the same category probably affected the choice.
MarketingExperiments teaches two formulas that can assist you in determining the ideal incentive, the first of which capitalizes on a visitor’s perception of the offer.
Perceived Value Differential (PVD)
PVD is used to select which among multiple possible incentives to test. The process begins with selecting and optimizing an incentive product to test. Then the presentation of the product must be optimized. The third factor, Cnn, in the MarketingExperiments Optimization Sequence, is the
channel.

For product, seek an item with a low manufacturing and distribution cost.
For presentation, consider these factors:
- Market price — Prospects should be familiar with a “comparable” item.
- Name — Choose a category with high perceived value, such as a DVD vs. a training video
- Description – Free DVD vs. Free Award–Winning Training Video
- Proximity or exclusivity — Others to whom the product is usually offered, such as “Once available only to licensed architects” (exclusivity).
- Packaging – Loose DVD vs. product in a box
- Design
 Not this… |
 This. |
Perceived Value Differential (PVD) is expressed in this formula:
PVD = Vp — C$n
Where:
“PVD” = Perceived Value Differential
“Vp” = Perceived Value of incentive
“C$n” = Net delivered Cost of incentive
Let’s look at an example of PVD, and use the PVD formula:
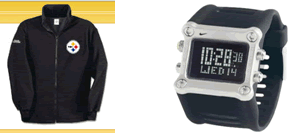
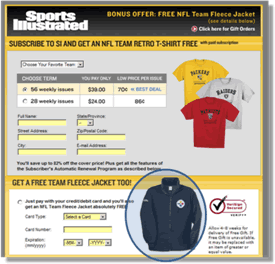
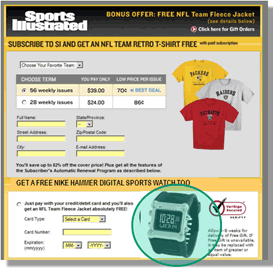
Which incentive do you think has a higher PVD, the jacket or the watch?
Fleece Jacket: Estimated perceived value (Vp): $50
Net Delivered cost (C$n): $10
PVD = Vp — C$n
PVD = $50 — $10
PVD = $40
Sports Watch: Est. Perceived value (Vp): $90
Net Delivered cost (C$n): $10
PVD = Vp — C$n
PVD = $90 — $24
PVD = $66
What you need to understand: The watch is an ideal incentive for this offer, due to its higher PVD, provided both products are equally desirable to target prospects.
Key Point: Maximizing PVD will drive the biggest differential between Net Revenue and Net Delivered Cost.
Return on Incentive (ROIc)
MarketingExperiments’ Return on Incentive (ROIc) formulas are also useful in determining the ideal incentive.
There are two ways to compute ROIc:
- Total ROIc: The total projected dollar difference between incentive cost and net increase in sales. It focuses on total “volume” of return, and may be preferable when cash reserves permit.
- Percent ROIc: The percent difference between cost and net increase in sales. It focuses on “efficiency” or rate of return, and may be preferable when cash flow is the primary factor.
First we’ll examine total ROIc:
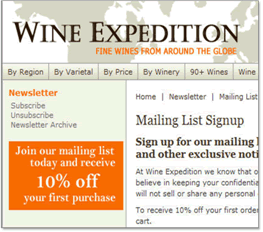
How do we estimate the total return on this incentive (10% discount)?
Assumptions:
- Incentive results in a 300 order increase in sales: from 700 orders to 1,000 orders.
- Avg. first order value is $88.
Avg. product profit margin is 40%.
ROIc = P$n — C$n
“ROIc” = Total return on incentive
“P$n” = Net profit impact from incentive
“C$n” = Net delivered cost of incentive
Step 1: Calculate P$n
P$n = Sales Vol. Impact (# orders) X (Avg. 1st Purchase Amt.) X (Avg. Margin %)
Therefore:
P$n = + 300 orders X $88 X 40% = $10,560
Step 2: Calculate C$n
C$n = Sales Vol. (# orders) X (Avg. 1st purchase amt.) X (Discount %)
Therefore:
C$n = 1,000 orders X $88 X 10% = $8,800
Step 3: Calculate ROIc
$1,760 = $10,560 — $8,800
Percent Return on Incentive (ROIc%) is the percent difference between cost and net increase in sales. Remember: ROIc% may be preferable when cash flow is the primary factor.
ROIc% = (P$n — C$n) / C$n X 100
Using the previous data, we find:
20% = (10,560 — 8,800) / 8,800 X 100
Here are the general questions you should answer in order to calculate the ROIc on a gift incentive for a subscription:
Step 1: Compute Net Profit Impact (P$n)
- Identify Net Profit Value of a new subscriber, short and long term.
- Subscription revenue
- Advertising & list revenue
- Avg. subscriber retention
Step 2: Compute Net Delivered Cost (C$n)
- Establish delivered cost per subscriber for gifts.
Step 3: Compute ROIc
- Short term for 1st month
- 12–month ROIc impact based on Long–Term Value (LTV) of the customer.
Case Study 2: Test Design
We performed a 37–day A/B/C split test for a financial research company.
Primary research question: Which Offer Page will provide the highest conversion?
Secondary research questions: How will incentives impact conversion? Where should they be placed?
Objective: To increase conversion by finding the ideal incentive.
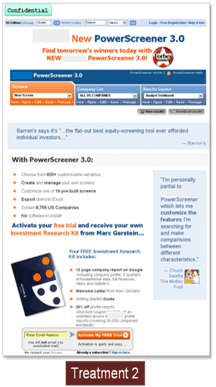
Editor’s Note: The company’s name and logo have been obscured in the page images for anonymity.
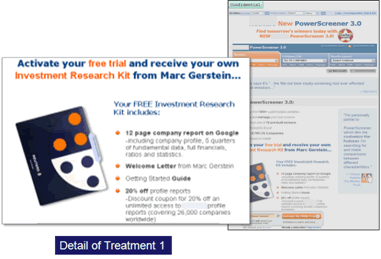
Both the Control and Treatment 1 provided an incentive on the Offer Page
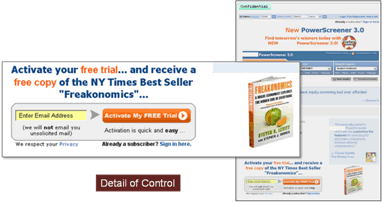
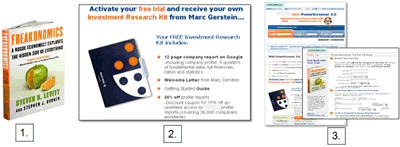
The Control’s incentive was a free New York Times best–selling book:
On Treatment 1 the incentive was a free investment research kit:
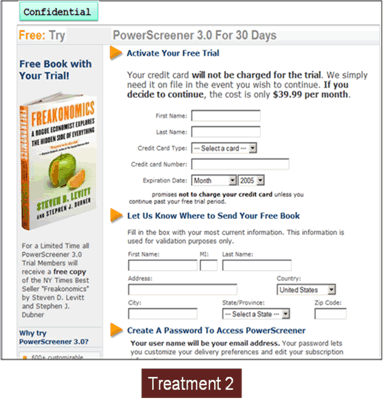
On Treatment 2, prospects saw the free investment research kit incentive on the offer page. . .
And the New York Times best–seller on the checkout page:
Which incentive performed best in our test?
- The New York Times bestseller?
- The research investment kit?
- Both (one on offer page, one at checkout)?
Results
| Case Study #2 | Unique Visitors | Sales | Conversion Rate |
|---|---|---|---|
| Control: Free NYT best–selling book | 12,424 | 159 | 1.28% |
| Treatment 1: Free investment kit | 10,592 | 75 | 0.71% |
| Treatment 2: Free book and free investment kit | 22,202 | 180 | 0.81% |
| Relative Difference (Control and T1): | 81% | ||
| Relative Difference (Control and T2): | 58% | ||
What you need to understand: The best–seller (Control) outperformed the investment research kit (Treatment 1) by 81%, and outperformed the combined incentives (Treatment 2) by 58%.
If one incentive is good, why wouldn’t two be better?
Observations
Treatment 2 with both incentives—the book and investment research kit—may have provided the same or higher conversion if both were listed on the offer page or if the incentives were reversed.
Treatment 2 may have been designed with the assumption that the free investment research kit was a better incentive than the free book. But prospects had to reach the checkout page to find out they would also receive the book.
Plus, a NYT best–selling book is a more immediately familiar concept than a new research kit and its component items. This could impact the perceived value based on presentation of these incentives.
Summary
- Incentives must be tested.
- There is an “ideal incentive.” Until you find one that has a significant impact on conversion, you must assume you have not yet found the ideal incentive.
- Avoid using an incentive that you have to “sell.” “Selling” an incentive competes with the primary offer.
- Three formulas can help you determine the ideal incentive:
- Perceived Value Differential (PVD): Used to select which among multiple possible incentives to test.
- ROIc: The total projected dollar difference between incentive cost and net increase in sales. Focuses on total “volume” of return. Preferable when cash reserves permit.
- ROIc%: The percent difference between cost and net
increase in sales. Focuses on “efficiency” or rate of return.
May be preferable when cash flow is the primary factor.
Related Marketing Experiments Reports
- Landing Page Optimization Tested—Creating Effective Incentives—The Science of the Art
- Landing Page Optimization: How Businesses Achieve Breakthrough Conversion by Synchronizing Value Proposition and Page Design
- Optimizing Site Design
- Optimizing Free Trial Offers
- Testing the Power of Urgency on Offer Pages
As part of our research, we have prepared a review of the best Internet resources on this topic.
Rating System
These sites were rated for usefulness and clarity, but alas, the rating is purely subjective.
* = Decent | ** = Good | *** = Excellent | **** = Indispensable
- 10 strategies for enticing visitors to buy or act ***
- Sales Promotions That Work ***
- The effect of sales promotion on post–promotion brand preference: A meta–analysis ***
- Converting Visitors into Buyers **
- The Effects of Customer Rebates and Retailer Incentives on a Manufacturer’s Profits and Sales **
Credits:
Editor(s) — Hunter Boyle
Frank Green
Writer(s) — Peg Davis
Bob Kemper
Contributor(s) — Gina Townsend
Boris Grinkot
Flint McGlaughlin
Bob Kemper
HTML Designer — Cliff Rainer
Mel Harris
Email Designer — Holly Hicks
Testing Protocols — TP1012


