How do you know when it’s better to raise prices to increase revenue or reduce prices and pump up Conversion Rate?
Price is undeniably a strong factor in the conversion decision process, but what will a price change do to your bottom line?
In this brief we will review the results of recent price tests and what they reveal about optimizing offers and increasing total revenue.
Editor’s Note: We recently released the audio recording of our clinic on this topic. You can listen to a recording of this clinic here:
Landing Page Optimization: Finding Ideal Price Points
Case Study 1
Test Design
Background: We conducted a two-week experiment for an online reference book publisher.
Our primary research question: Which annual subscription price for unlimited access to their research would produce the highest revenue per visit as well as the highest projected long-term (LT) revenue?
The Control offered an annual membership fee of $69.95. Prices tested in the treatments were
- $50.00
- $59.95
- $75.00
- $79.95
All other factors stayed the same.
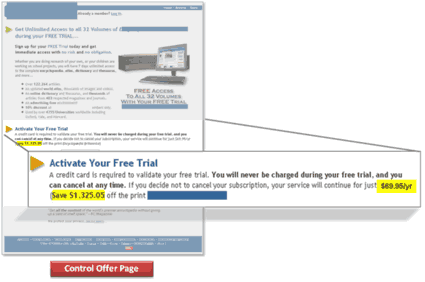
The Control offer page and each Treatment page received 20% of the traffic generated by a reference article page:
Each Treatment offer page replaced the original price plus savings off the print edition of the reference books (noted above in yellow) with the test price and savings:
| Price | Save |
| $50.00 a year | $1,345.00 |
| $59.95 a year | $1,335.05 |
| $75.00 a year | $1,320.00 |
| $75.00 a year | $1,315.05 |
Results
| Pages Tested | Price Point | Paid Subs | Paid SubsCR | TotalRevenue |
|---|---|---|---|---|
| Control |
$69.95
|
183
|
0.48%
|
$12,800.85
|
| Treatment 1 |
$50.00
|
218
|
0.57%
|
$10,900.00
|
| Treatment 2 |
$59.95
|
196
|
0.51%
|
$11,750.20
|
| Treatment 3 |
$75.00
|
181
|
0.47%
|
$13,575.00
|
| Treatment 4 |
$79.95
|
162
|
0.42%
|
$12,951.90
|
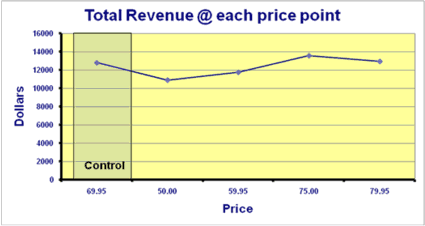
What you need to understand: It was no surprise that the lowest price ($50) resulted in the highest conversion to paid subscriptions, but it also resulted in the lowest Total Revenue. The $75 price produced the highest revenue, but revenue began to decline at the $79.95 price point.
With just one data point beyond $75, can we say with confidence that $75 is the ideal price point?
No.
Though Total Revenue began to dip at $79.95, two data points—$75 and $79.95—are not enough to be confident that this marks a transition to elastic demand.
We plan to experiment further above $75 to establish where demand becomes substantially elastic.
Key point: You must test a variety of prices to find the optimal point that will contribute the most to your Total Profit (or Total Revenue). Until your research uncovers your maximum profit price point and you adjust it there, you are leaving money on the table.
If you are not familiar with the term Price Elasticity of Demand or how to test it, here is a brief primer:
Price Elasticity of Demand (Ed) is a measure of how much product demand changes in relation to a change in price if all other factors remain constant.
| When Ed is | and Price | then Total Revenue | Result |
|---|---|---|---|
|
<1
|
increases
|
increases
|
Inelasticity
|
|
<1
|
decreases
|
decreases
|
|
|
=1
|
increases
|
doesn’t change
|
Unit elasticity
|
|
=1
|
decreases
|
doesn’t change
|
|
|
>1
|
increases
|
decreases
|
Elasticity
|
|
>1
|
decreases
|
increases
|
You can use this formula to calculate Ed for a specific price test:
Key point: When computing Price Elasticity of Demand, it is the magnitude of the quotient (i.e., the absolute value) that is used for the threshold comparison; in other words, ignore negative values.
An excellent way to perform an in-depth Ed comparison is to use the MarketingExperiments Price Testing Evaluation Worksheet. The no-cost template is available at this link:
MEC Price – Testing Analysis Tool
The tool includes a profit calculator for free trial offers, a subscription ROI calculator, as well as a Price Elasticity of Demand calculator.
If you are interested in quickly calculating nominal revenue and gross profitability, then ignore the “Business Costs” section at the top of the MarketingExperiments Price Testing Evaluation Worksheet and go directly to the “Test Results” section.
If you want to compute the estimated business impact of a price change on monthly profit and ROI, including both fixed and variable product and advertising costs, then fill in both the “Business Costs” and the “Test Results” sections, then refer to the “Computed Monthly Profitability” section at the bottom.
Microsoft also offers an Excel template that will perform a simple Price Elasticity of Demand calculation and chart total revenue:
Excel Price Elasticity of Demand Calculator
Case Study 2
Test Design
Background:We worked with a leading psychiatrist and author to determine how to maximize online sales of his new book.
We conducted a three-day A/B/C test on three price points:
- $ 7.95
- $14.00
- $24.95
| Price Point | Orders | Total Revenue |
|---|---|---|
|
$7.95
|
390
|
$3,100.50
|
|
$14.00
|
480
|
$6,720.00
|
|
$24.95
|
300
|
$7,485.00
|
What you need to understand: Because of the higher revenue per order, the $24.95 price point generated the most revenue, but the $14 price point generated more orders.
The higher price on the same book created a higher profit margin, but an additional 180 customers at the $14 price point may actually be worth more in the long run than the additional $765 of immediate revenue generated at the $24.95 price point.
Key point: Weigh the advantage of selecting a price that generates slightly less initial revenue if that price also generates significantly more new customers. The average lifetime value of your customers and your ability to make additional sales to them will be the determining factors.
While for electronic and subscription-based products it may be sufficient to use Total Revenue, physical products generally warrant consideration of final delivered cost and maximization of Total Net Profit instead.
Case Study 3
Test Design
Background: We performed an ad-hoc price test on a professional industry conference. Though the previous year’s conference did very well, the goal for the next year’s event was set 23% higher.
Our primary research question: Will offering a discount on the price drive demand for the new event?
In the weeks leading up to the new event they first tried offering a 10% discount on a ticket to several lists of qualified leads. Hundreds of thousands of leads saw the event advertised via newsletter banners, but only two sales resulted from discounting the price in an attempt to boost demand.
We then suggested a different approach:
- increase prices;
- add value to the event by “bundling-in” the very latest report analyzing the industry segment along with an opportunity for relevant professional training, then discount the total retail price of the bundled offer.
The original retail price of the components:
| Conference | |
|---|---|
| Previous years price | New price |
|
$1,305
|
$1,505
|
| Professional Training Course | |
| Previous years price | New price |
| $605 |
$1,005
|
| Published Materials | |
| Previous years price | New price |
| $257 |
$507
|
| New Event Prices | |
|---|---|
| Conference | |
| New Price | Effective Discount of Bundled Offer |
|
$1,305
|
–$352
|
| Professional Training Course | |
| New price | Effective Discount of Bundled Offer |
|
$1,005
|
–$505
|
| Published Materials | |
| New price | Effective Discount of Bundled Offer |
|
$507
|
–$155
|
|
Totals: $3,017
|
–$1,012
|
| Bundled offer for new event: $2,005 (33.5% off) | |
Results
| Previous Event Sales @ $1,305 (Conf. only― single ticket) |
New Event Sales @ $1,505 (Conf. only― single ticket) |
New Event Sales @ $2,005 (Bundled Offer) |
New Event Sales Totals |
Relative Increase in Total Ticket Sales |
Relative Increase in Total Revenue |
|
|---|---|---|---|---|---|---|
| Tickets Sold |
275
|
159
|
241
|
400
|
45%
|
— |
| Total Revenue | $358,875 | $239,295 | $483,205 | $722,500 | — |
101.3%
|
What you need to understand: The “bundle then discount” approach to the new event enhanced its Value Proposition, drove ticket sales, and increased revenue over the previous event by 101%.
It may seem counter-intuitive to increase your prices, but businesses often undercharge for the products and services they provide.
High price does not always equal high value, but a price that’s too low may cause potential customers to underestimate the value and quality of the product. In the minds of many consumers, you get what you pay for, and you value more what you pay more for.
Be sensitive to business considerations when designing offer pricing. In this case, adding the professional training component probably increased the likelihood a company would allow an employee to attend the conference. When budgets are tight, companies cut the “nice-to-have’s” and fund what will help their bottom line.
Summary
- Test a variety of prices to find the point that will maximize your total long term profit. Keep testing until you find the price point above which Net Profit continues to decline.
- Know the average long-term value of a customer. There may be an advantage in selecting a price that generates slightly less immediate revenue if that price also generates significantly more new, loyal customers.
- Know the demand characteristics for your products. If demand is inelastic according to Price Elasticity of Demand (E<sub>d</sub>) calculations, a price increase should increase Total Revenue.
Related Marketing Experiments Reports
As part of our research, we have prepared a review of the best Internet resources on this topic.
Rating System
These sites were rated for usefulness and clarity, but alas, the rating is purely subjective.
* = Decent | ** = Good | *** = Excellent | **** = Indispensable
- The Strategy and Tactics of Pricing: A Guide to Growing More Profitably (4th Edition) ****
- Pricing Psychology Report and 46 Ways to Raise Prices (.pdf publication) ****
- Planning Your Pricing Strategy—How to Get the Price Right (free podcast) ***
- Price Your Product or Service: How to Build a Pricing Strategy ***
- NetMBA Business Knowledge Center: Pricing Strategy ***
- Super-Charge Your Business with Profit Pricing Strategy **
- Developing a Pricing Strategy, Part 1 **
- Developing a Pricing Strategy, Part 2 **
- Profit Margin Calculator **
Credits:
Editor(s) – Frank Green
Bob Kemper
Writer(s) – Peg Davis
Gaby Diaz
Contributor(s) – Aaron Rosenthal
Flint McGlaughlin
Bob Kemper
HTML Designer(s) – Cliff Rainer
Mel Harris
Email Designer – Holly Hicks
Test Protocol:
- TP1057


