Today, ROI is everything – especially in a slumping economy. Are your current metrics giving you the full story?
Probably not.
MarketingExperiments estimates that up to 75% of the data Web marketers collect are either misleading or inaccurate. And expertise with Web analytics is rare, according to our recent poll.
Most marketers remain uncertain about what to measure, whether the results are reliable, and what steps to take based on their data.
This brief covers the key steps to determining your essential metrics, with four critical elements to keep in mind. Weve also provided a tool you can use right away to improve your marketing ROI.
Editor’s Note: We recently released the audio recording of our clinic on this topic. You can listen to a recording of this clinic here:
Measuring What Matters: How simplifying your metrics can increase Marketing ROI by up to 75%
Misleading Metrics
During our April 16, 2008, Web Clinic, 74% of the marketers we polled rated their experience level with Web analytics as “moderate” or “novice.”
However, years of experience are no fail-safe. A recent survey by Web Analytics Demystified of marketers who either perform their own analysis or get results from an agency found that their #1 concern was the ability to use the data for decision-making.
Their #2 concern was accuracy of the data.
Online testing can present a “minefield” of data due to:
- Inadequate tracking;
- Improperly configured measurement tools;
- Faulty test structure and protocols;
- Validity threats;
- Inconclusive results.
And the data itself can be shaky:
- Different analytic tools filter data differently when it comes to internal and external IP addresses, HTTP status codes, and categorizing anomalies and content.
- Security software can block ad server content and delete cookies.
- Ad tags may not be captured immediately; visitors can bounce away before pages fully load.
- PPC programs may put a time limit on counting visitors: A click on the same ad within a few seconds may appear as one visit, not two.
- Server logs may not be configured to capture all the information you need.
Even if you’re confident in the results, collecting too much data or only applying a big-picture perspective has its own pitfalls.
Both may obscure important results — the “diamonds in the rough” that point to significant ROI opportunities.
The following case study illustrates this point. . . .
Case Study 1: Test Design
We recently performed a complex A/B test of both ad and keyword CTR for a partner that owns multiple domain names.
We grouped selected domains into eight different test sets covering 50 different domain “themes.”
Objective: Increase keyword and ad click-through rates.
Primary research question: Which domain template design will produce a higher keyword CTR and ad CTR?
The conversion paths for each test were set up identically . . .
In each Treatment, we tested refinements to the already highly optimized pages, applying MarketingExperiments’ best practices to reduce site disruption. For example, we:
- Removed a generic photo;
- Added a linked keyword navigation bar to the masthead;
- Underlined keywords to emphasize that they were clickable;
- Removed the call-to-action arrows from the vertical navigation;
- Reordered keywords in navigation bar based on user searches.
Results
When we reviewed the overall performance of the tests, we did not observe any improvement in ad CTR from the Treatments:
| Case Study #1 | Control | Treatment | Difference |
|---|---|---|---|
|
Test 1
|
Ad CTR
|
||
|
Overall Performance
|
15.62% | 14.59% | -6.61% |
|
Test 2
|
Ad CTR
|
||
|
Overall Performance
|
42.94% | 42.11% | -1.92% |
|
Test 3
|
Ad CTR
|
||
|
Overall Performance
|
46.10% | 45.54% | -1.23% |
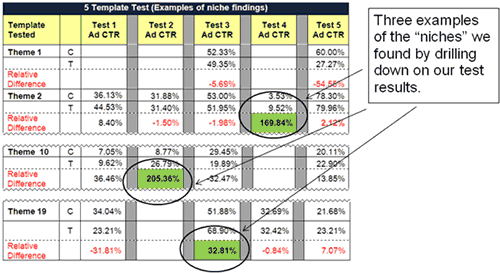
However, a more granular look at the data identified 24 “niches” of significant results . . .
What you need to understand: We were able to identify 24 “niches” where ad CTR increased from 5% to 248%, averaging 65%.
Observations
Examining the data from a granular perspective showed several “hidden” opportunities to increase ROI that might have been obscured by looking only at the aggregate results.
Based on the niche results, implementing the highest yielding templates from each test has the potential for significant increases in ad CTR.
Let’s review another test where looking only at aggregate results could cause us to overlook data with major implications for ROI. . . .
Case Study 2: Test Design
We performed a variable cluster test for a business selling financial information subscriptions.
The objective was to increase conversions to paid subscriptions.
Primary research question: Which offer page will produce the highest sign-up conversion rate?
Secondary research question: Which price point will convert best?
- A single annual payment with a free trial
- A single annual payment with no free trial
- Monthly payments with a free trial
Our optimization strategy included changing offer page copy, revising page layouts and the email capture form, optimizing calls-to-action, and streamlining the order path (shorter/fewer clicks):
Results
| Case Study #2 | ||||
|---|---|---|---|---|
| Samples | Successes | Failures | Conv. Rate | |
| Control | 98,723 | 238 | 98,485 | 0.24% |
| Treatment | 76,094 | 204 | 75,889 | 0.27% |
| Actual difference: | .03% | |||
| Statistical significance level: | .05% | |||
What you need to understand: The actual difference had to be at least .05% to be statistically significant. Though the difference was not significant, we did find a recommendation we could make to our partner when we examined one key metric the test produced . . .
| Case Study #2 | |||||
|---|---|---|---|---|---|
|
Payment Option Analysis
|
Price |
Conv. Rate
|
Paid Subs Retention Rate
|
Revenue (LTV) /Visit
|
|
| Control | Monthly Payments with Free Trial | $59.95 | .06% | 3 months | $0.11 |
| Annual Payment with Free Trial | $399.95 | .18% | 1.5 years | $1.07 | |
| Treatment | Monthly Payments with Free Trial | $59.95 | .09% | 3 months | $0.16 |
| Annual Payment with Free Trial | $399.95 | .07% | 1.5 years | $0.44 | |
| Annual Payment with No Free Trial | $399.95 | .11% | 1.5 years | $0.64 | |
What you need to understand:When we looked at Lifetime Value (LTV) per Visit, ROI on annual payments was significantly higher than the monthly payment option: we noted increases of 872% in the Control, and 300% in the Treatment.
Observations
Based on these results, the partner could improve ROI significantly by discontinuing the monthly payment option.
Identifying and Tracking Essential Metrics
Essential metrics are those that help you “fix the gap” between what visitors are already doing on your site and what you want visitors to do on your site. Here are the key steps that will help you identify and track those actions.
Step 1: Understand your own business objective. For example:
| Business | Objective | Example Metrics |
|---|---|---|
| E-commerce | Persuade visitors to purchase products or services. | # of orders Conversion rate Total cost Total revenue Revenue-per-visit Profit-per-visit Average order value |
| Lead Generation | Capture information about a visitor to use in future communications. | Registrations Cost per inquiry Cost per qualified lead Conversion rate Incentive downloads Subscriptions Partner referrals Requests for quotes/contact |
Step 2: Understand there are really only four elements you can measure.
- The AMOUNT of activity on your site — page views, visitor sessions, returning visitors, etc.
- The SOURCE of that activity — referrers, search terms, languages, countries, organizations, etc.
- The NATURE of that activity — entry pages, exit pages, browsers, platforms, JavaScript versions, cookie support, screen resolutions, page refreshes, page load errors, average time per page, etc.
- The RESULTS of that activity — click trails, most requested pages, number of page views, sign-ups, orders, etc.
Key Point: Essential metrics are those that help you understand what someone was thinking as they moved through your site. If you simply note the action report a number without understanding the thinking behind it, you will not be able to optimize your site to its full potential.
Step 3: Check the reliability of your data.
Have at least two sources of information to help you compare results and more quickly identify anomalies and potential inaccuracies.
For example, several marketers who use a licensed analytics program such as Hitbox or Webtrends, also use a free tool like Google Analytics.
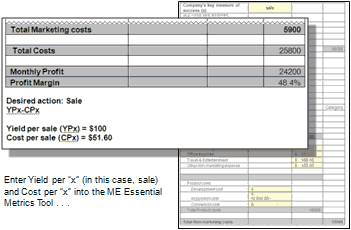
Step 4: Calculate the cost and yield of each desired action on your site.
This can be expressed with a short formula: YPx-CPx
- CPx is the average cost per desired action
- YPx is the average yield per visit (or sale, or subscription)
This calculation gives you the average revenue for each desired action.
Each source of traffic to your site will have a different cost associated with it; for example:
- PPC ads
- Bulk (CPM – cost per thousand) advertising
- Paid Directory listings
- Affiliate relationships
- Other partner relationships
- Search Engine Optimization
- Newsletters
Questions to ask…
- How much does it cost to get a single desired action (visit; sale; subscription; donation)? Include internal costs, such as staff time, supplies, and fees.
- What is the value of each action?
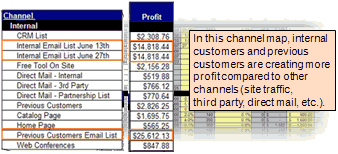
… a channel map can help you find the answers:
(Note: The MarketingExperiments Landing Page Optimization Course provides a channel mapping tool and instruction on how to use it.)
Key Point: Start by identifying the traffic sources the channels that give you the highest ROI, the highest yield per visit with the lowest cost, and optimize them first.
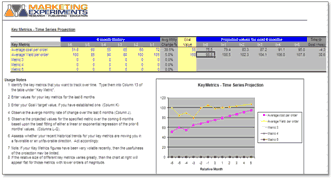
The MarketingExperiments’ Essential Metrics Tool can assist you in calculating YPx-CPx as well as help you track other essential metrics against annual goals:
https://www.marketingexperiments.com/metrics-tool
The purpose of the tool is to filter the hundreds of different metrics that are available to you in your Web analytics reports, identifying and tracking the ones that will most directly help you meet your current objectives. The tool also works to help you meet your future goals by projecting historical values six months ahead:
Key Point: Target metrics with the greatest potential impact on cost and yield.
For example, metrics for a subscription site should include:
- Total Cost ($/mo)
- Total Revenue ($/mo)
Plus:
- Total Subscribers at beginning of month
- New subscribers added
- Subscriber drop-out
- Average subscriber retention (months)
- Distinct referring URLs
- % of traffic from top 20 referring search terms
Others to consider:
- Net 30-day change in total subscribers
- Monthly revenue per active subscriber
- Monthly Yield per new subscriber
- Monthly Cost per new subscriber
- Monthly Profit per new subscriber
- LTV per new subscriber
USING ESSENTIAL METRICS: THE ULTIMATE STEP
When you can identify and track essential metrics, you’re prepared to take the most critical step toward peak optimization: Anticipating the sequence of thought in the mind of your customer.
It’s an easy and common mistake to think in terms of what your company wants (leads, conversions, sales) instead of what your customer wants.
Once your numbers tell you the what, avoid the trap of stopping there. Now, you are in the position to do the real thinking.
What you’re really trying to measure with essential metrics is your prospects’ and customers’ satisfaction level. For instance, bounce rate is really customer surprise or disappointment: The site was not what they expected, so they left.
Anticipation of the customer’s thought process is the key to using essential metrics to fully optimize your site. By examining their actions, you can identify trends and patterns and find the areas of your site where improvements will produce the biggest ROI gains.
Summary
- The key to identifying and tracking essential metrics is to first understand your own business objective.
- Essential metrics are the ones that lead to optimization decisions and action.
- You have to know what visitors are already doing on your site before you can effectively change your site and what visitors do when they land there.
- Target metrics with the greatest potential impact on cost and yield.
- Identify the traffic sources — the channels — that give you the highest ROI, the highest yield per visit with the lowest cost, and optimize them first.
- Never assume your metric system is accurate; carefully monitor for anomalies.
- Test, measure, and test again. Small increases can add up to a big ROI over time.
Related Marketing Experiments Reports
- Essential Metrics for Online Marketers
- Finding Ideal Price Points
- The ROI on PPC vs. Affiliate Marketing
- Update—The Order Process Tested
- Web Site Conversion Erosion
- Lead Generation
As part of our research, we have prepared a review of the best Internet resources on this topic.
Rating System
These sites were rated for usefulness and clarity, but alas, the rating is purely subjective.
* = Decent | ** = Good | *** = Excellent | **** = Indispensable
- American Marketing Association On-demand Webcasts ***
- SEER Interactive ROI Calculator***
- SME Toolkit Email Marketing ROI Calculator ***
- When Art Meets Science: The Challenge of ROI Marketing **
- Measuring Marketing ROI – How Low Can You Go? (requires sub.)**
Credits:
Managing Editor — Hunter Boyle
Writer — Peg Davis
Copy Editor — Frank Green
Contributor(s) — Flint McGlaughlin
Bob Kemper
Gina Townsend
Maria Hendricks
Heather Andruk
Ana Diaz
HTML Designer(s) — Cliff Rainer
Mel Harris
Email Designer — Holly Hicks
Testing Protocols — TP1083
TP1067


