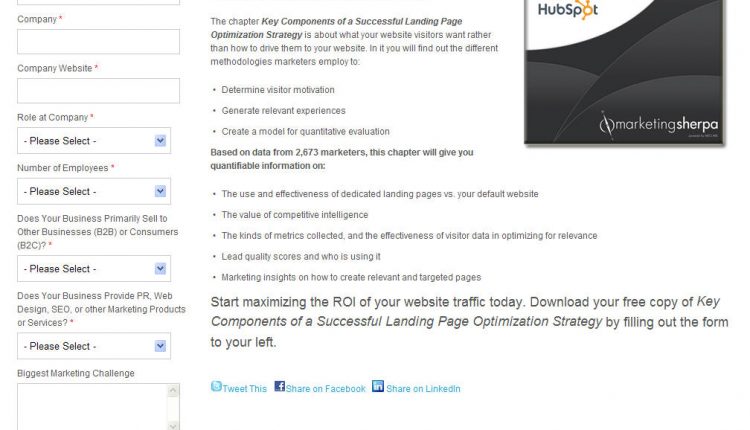
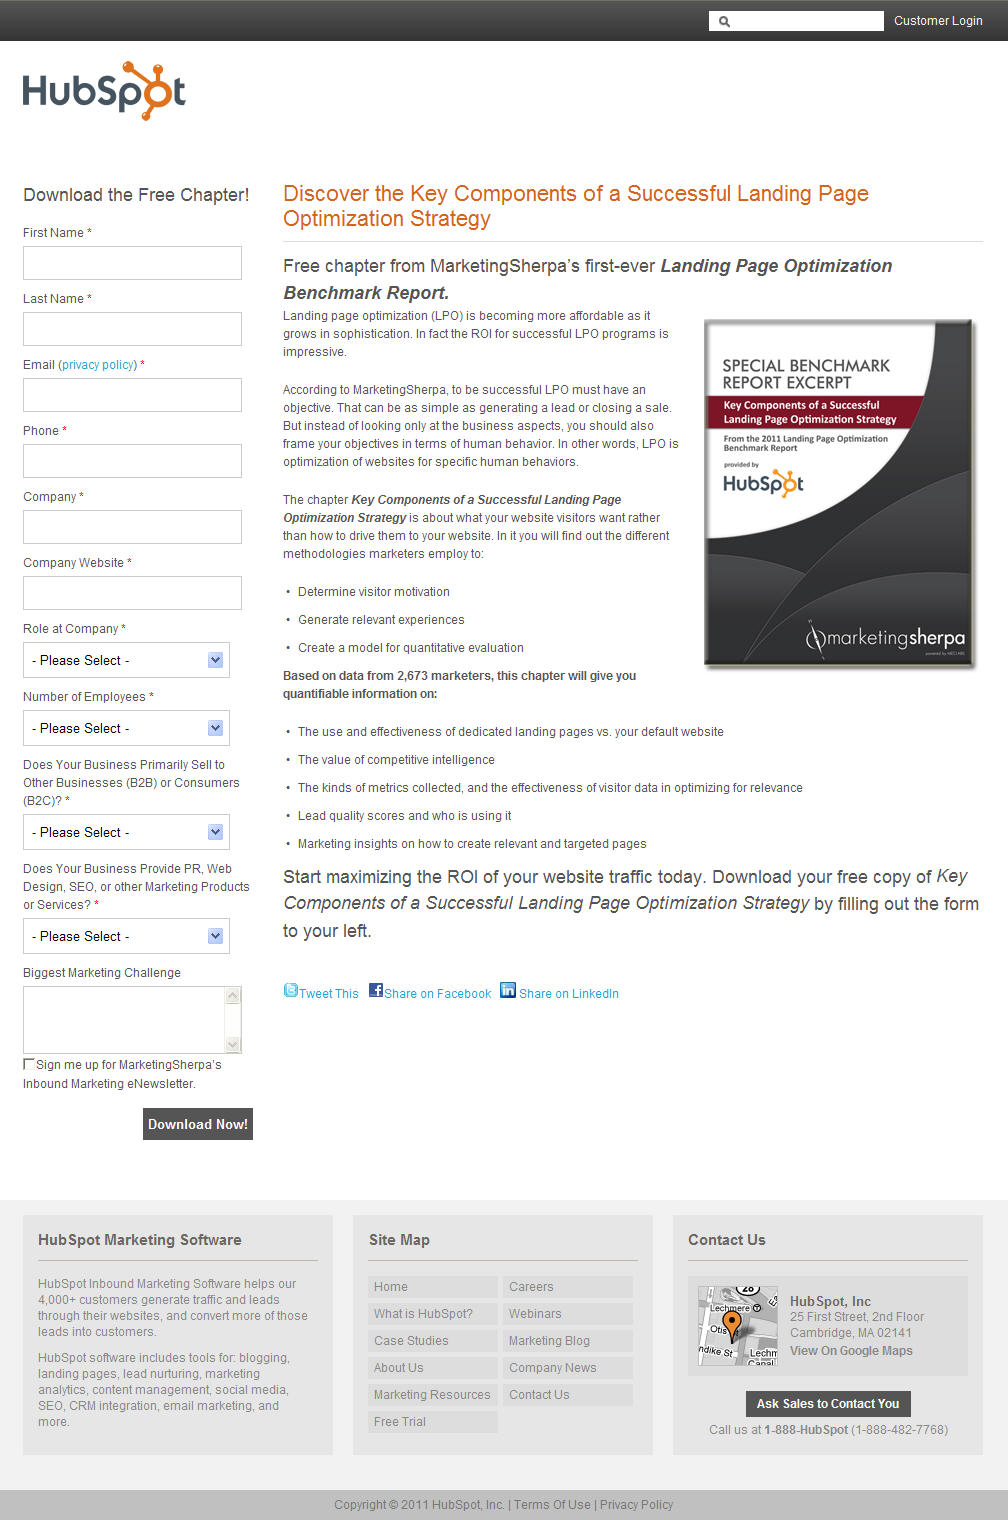
As discussed in my last blog post, we reviewed how the marketing force of 200 marketers at Optimization Summit was utilized to design the following test:
.
Control (click to zoom) Treatment (click to zoom)
You can read the experiment details, how we got 200 marketers to agree, and few insightful reader comments in Wednesday’s post. In this second post now, as promised, we will look at the results and what insights might be gained from them.
First, let me just forewarn you, this post will be a little on the detail side of things. I really wanted to give you a clear of a picture of what happened, and that took a little more fleshing out than usual.
So, what were the final results?
According to the final numbers, our focus group of 200+ marketers was able to increase the amount of leads generated from this page by a whopping 0.7% at a 90% confidence level.
This seems like a modest gain to say the least, but keep in mind that we have worked with research partners in which a 1% gain meant a significant increase in revenue. In this case, we were spending many resources to drive people to this page, so even a small gain could potentially generate impressive ROI.
With that said, it is also very interesting to note here the incredibly high conversion rate for this campaign, 47% (meaning nearly one out of every two visitors completes the form). This means that incoming traffic is incredibly motivated, and therefore any gains obtained through testing will most likely be modest.
As taught in the MarketingExperiments Conversion Heuristic, visitor motivation has the greatest influence on the likelihood of conversion. If your visitors are highly motivated, they will put up with a bad webpage in order to get what they want. Not to say either one of these pages are bad, but with such a motivated segment, it will be hard to tell any difference between the designs.
But something still didn’t seem right…
Despite the incremental success, something smelled rotten in Denmark (and it wasn’t Adam Lapp) during the course of the test. We collected data every hour (though some hours are consolidated in the charts below), and by the end of the first day of testing it looked as if we had a clear winner.
At 11:50PM of Day 1, the Treatment was outperforming the Control by 5% and had reached a 93% confidence level. The test was in the bag, and attendees were breaking out the bottles of Champagne (okay… a little stretch there).
However, in the morning, everything had shifted.
The Treatment which had performed with an average 51% conversion rate throughout the previous day, was now reporting performance at a comparatively dismal 34% conversion rate. This completely changed the results, the Control and Treatment were virtually tied, and the confidence level was now under 70%.
What happened? Why the shift? Did visitor behavior change drastically over night? Did some extraneous factor compromise the traffic?
Simple in principle, messy in practice
This leads me to one of the key things I learned during this experiment – testing is messy. When you get real people interacting with a real offer, the results are often unpredictable. There are potentially real-world extraneous factors that can completely invalidate your results. In this test, the aggregate data claimed an increase with a fair level of confidence, but something was interfering with the results. We would have to dig down deep to really figure it out.
Maybe it’s just the thrill seeker inside of me, but it was the unexpected messiness that made this test so exciting. Throughout the conference, I eagerly watched the data come in, not knowing what would happen next. I felt like a kid watching a good sci-fi movie, and at this point of the test in particular, when nothing seemed to make sense, I was on the edge of my seat.
So, how does the story end?
Before moving on, we want to ask you:
- Why do you think the treatment results dropped drastically overnight?
- Have your tests ever done that?
- How would you pinpoint a cause?
- Where would you look first?
Oh and by the way, if the overnight drop hadn’t occurred, the Treatment would have outperforming the Control by 6% with a 96% statistical confidence level. What do you do with that?
Editor’s note: Join us Tuesday on MarketingSherpa when Austin reveals the results of this thrilling trilogy by releasing the entire case study in full. To be notified when that case study is live, you can sign up for the free MarketingSherpa Email Marketing Newsletter.
.
Related Resources:
Live Experiment (Part 1): How many marketers does it take to optimize a webpage?
Evidence-based Marketing: Marketers should channel their inner math wiz…not cheerleader
Landing Page Optimization Workshop: Become a Certified Professional in Landing Page Optimization
B2B Marketing Summit: Join us in Boston or San Francisco to learn the key methodologies for improving your conversion rates


The live experiment at the Optimization Summit was a beautiful way of involving the attendees. For me personally, it was cool to see first hand how Marketing Experiments approach testing and analyzing test results!
Thanks for an amazing summit in Atlanta, I’ll be back next year – and thanks for the link to my interview with Adam Lapp. Just skip the first minute – it’s in Danish 😉
– Michael
When looking for the cause of conversion differences, my first question would be what is different overnight. That is particularly important if you are buying traffic through pay per click (ppc) advertising. Even if what YOU are doing overnight doesn’t change, what those bidding against you are doing can make a big difference. If a major competitor or several competitors turn their ads off outside business hours yours may move to the top of the page and get far more of what I call “automatic” clicks from people who don’t actually read the ads before clicking. When you’re further down the page you get more serious buyers than when you’re in the top 2-3 positions.
As you probably know – but many don’t – there are vastly more variables than most people realize. Because you can not control for many of them you have to look for patterns over time to determine cause OR even if you can not determine the cause you can adjust what traffic you acquire from what sources.
I strongly encourage anyone buying ppc traffic to look at daily conversion rates by keyword. There are serious issues with receiving converting versus non-converting traffic; a situation we call distribution fraud. If you only look at your conversion rates for all keywords OR by the week or month you will not see which keywords are being targeted with non-converting traffic.
The worst ppc situation is for traffic or cost to go up at the same time your usual conversion rate drops to zero. I have several posts about pay per click linked from my Best of GrowMap page on my blog that explain this in detail. I’ll link this comment to that page so that those who need that information can find it.
Maybe a technical issue.
For example, the image in the treatment might not have been loading at that time or maybe some validation JS didn’t load causing issues when trying to complete the form.
I’m not a server log expert but I might start there to diagnose the problem.