 As I delve deeper into the abyss of numbers while preparing for my interactive panel on validity at Optimization Summit, I’m coming across more fallacies about validity in marketing tests. Here’s one I recently heard…
“We were told that if we send each treatment to 4,000 people on our list we would have a valid test.”
I changed the number to protect the innocent, but this is a common misconception.
That’s why they play the game
Now I’ll give them credit. The misconception above is thinking along the correct lines. A large enough sample size is necessary to ensure you have validity.
However, while you can take an educated guess, it is impossible to know the minimum sample size before the test is actually run. Just ask a Las Vegas bookie.
Because, an important factor in sample size determination is the difference in results between the treatments. If the treatments return very different results, it’s much easier to confidently say that you really do have two (or however many) emails that will perform differently. You don’t need as many samples to do that.
However, if the treatments have very similar results, you want many more observations to see if there really is a difference.
Think of it this way. I recently went to Disney World, and while waiting in line for a ride the line split.I was curious to see if more people would go to the left or the right.
If I saw nine people go to the left, and one go to the right, I’d feel pretty confident that people tend to favor the left.
But what if the split was six to the left and four to the right? I would want way more observations to feel confident that there is a real difference, whether people really do favor one side over the other, or if what I’m seeing is just random chance. Maybe for the next ten people, six will go to the right and four to the left.
And that’s why it’s impossible to determine the exact sample size you need for every test. You would, essentially, need to know the response you would get for each treatment before you tested. And, after all, that’s why we run the tests. Because it’s nearly impossible to guess on an outcome. Again, just ask a Las Vegas bookie. The house often wins. But not always.
I asked Phillip Porter, a data analyst here at MECLABS, for a more official sounding explanation than my Mickey Mouse example above; an explanation that you can use verbatim to sound smart and win any internal debate. Here’s what he said…
“Significance is based on sample size and effect size. The larger the sample you have, the smaller effect size you can find to be significant. The larger the effect size present, the smaller sample size you need to find significance. Larger sample sizes are generally better, however any difference, no matter how small, can be found to be significant with a large enough sample size.”
“Imagine the thrill of getting your weight guessed by a professional.”
However, much like Navin R. Johnson’s carnival barker in “The Jerk,” it doesn’t hurt to take a guess as long as you know what you’re doing. And if you truly are a professional, you don’t have anything to lose by guessing (except maybe some Chiclets).
“You can guesstimate before you run the test, but the actual numbers may not match what you were expecting. If you could guesstimate correctly every time before running the test, why would you need to run the test?” Phillip said. Proving not only that great minds think alike, but that it doesn’t hurt to try to get a sense for how much traffic or email recipients you need to get a valid test.
In fact, we include a pre-test estimation tool in our Fundamentals of Online Testing course. There’s one in the MECLABS Test Protocol as well, which our researchers use for all of their experimentation.
But a true professional will still run the final numbers…
How to determine if you have a big enough sample size
I don’t want to get all Matt Damon writing on a chalkboard in “Good Will Hunting” on you, but (and read this in your best Boston accent) it comes down to the math. I had a tough time on how I could truly serve you with this blog post. The last thing I wanted to do was raise a problem and not give you a solution (or only provide a paid solution).
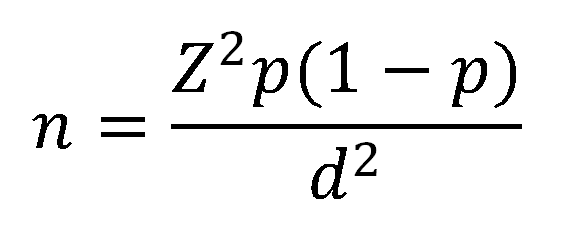
I think, in the end, the best thing to do is just provide you with the equation. The sample size calculation that we use internally can be found in Cochran, W. G. (1977). Sampling Techniques, 3rd ed., Wiley, New York.):
Phillip explained the formula…
“This formula provides us with the minimum sample size needed to detect significant differences when Z is determined by the acceptable likelihood of error (the abscissa of the normal curve). The value of Z is generally set to 1.96, representing a level (likelihood) of error of 5%. We want the highest accuracy possible, with the smallest sample size. This level of error, 5%, gives us the best tradeoff between these two goals.
p is the conversion rate we expect to see (estimate of the true conversion rate in the population), and d is the minimum absolute size difference we wish to detect (margin of error, half of the confidence interval).”
We are working on a dead simple validity tool (the iPod of validity tools, if you will) to pass out at Optimization Summit. But for now, you can try putting the above formula in your own Excel spreadsheet.
Even Phillip admitted, “If you are trying to calculate this by hand it can look intimidating, but if you build the formula in Excel it is pretty simple.”
Related Resources
Optimization Summit 2011 – June 1 -3
Email Marketing Tests: What to do when a radical change produces negligible results
Online Testing and Optimization: ROI your test results by considering effect size
Online Marketing Tests: How could you be so sure?
Photo attribution: Rainer Ebert


very clear explanation, thanks, and of course a very good observation that there’s no way to know the statistically-significant sample size in advance. From a practical perspective, however, I think you can run into issues if you approach a test with a “we have to wait and see” mindset, since it can lead to peeking at results early and/or extending a test endlessly looking for statistical significance that may never come. I think the solution is to decide in advance what % change you need to see to make the test worthwhile, which will then let you know how big the sample size needs to be.
Ana,
I couldn’t have said it better myself. The challenge with trying to write a simple, straightforward blog post on an inherently complex topic is you simply must leave so much out. So thanks for adding that.
For more info, feel free to check out my recent blog post on effect size.
It would help a great deal if you could provide some example cases. Thanks!
Peter,
Here’s one off the top of my head — this recent email subject line test. As you can see, two of the treatments were significantly different, but two weren’t…and yet they all had roughly the same sample size.
We had an even bigger sample size for this email copy test and could not identify a statistically significant difference.
It just goes to show you can not just rely on what you think is a big sample size, and assume since one results number is bigger than the other, than it is necessarily better.
Hi Daniel,
I am referring to the formula. Can u give examples showing how you calculate the sample size and the assumptions you make for the p and d values. I understand the “Z”, but not really clear on exactly the meaning of the “p” and the “d” how u come up with the values for “p” and “d” variables. Thanks!
Peter,
I’ll give you an example for once you’re running a test, and you want to decide if you can close it yet, in other words, if you have yet achieved a high enough sample size for a statistically valid test.
Z correlates to your level of confidence. To simplify this, just use the number 1.96 for Z and you will have chosen a 95% level of confidence. You do this because, essentially, 95% of the area under a bell curve lies within 1.96 standard deviations of the mean.
You plug in p and d based on your results. For these two variables, you don’t have to make any assumptions if the test is already running. I’ll give you a sample scenario…
Landing Page A is achieving a 29% conversion rate
Landing Page B is achieving a 30% conversion rate
…and you want to see if you’ve achieved enough samples to have a statistically valid test.
In this case, for p you would put 0.295 (your true conversion rate, in other words, the average of the conversion rates you’ve observed) and for d you would put 0.01 (the difference between the two conversion rates, the absolute — not relative — difference that you have observed).
You do the math, you carry the 2, whip out the slide ruler, and the answer is… 7,990. That is how many samples you would need per treatment. So if you have surpassed that number, you’re good to go.
If not, you might consider keeping the test open until you get there. Keep in mind though, at that point you might need to recalculate since your conversion rates may have changes slightly.
As a math geek doing marketing, this is a great article. I only wish more of my clients had the resources to truly evaluate multiple options with significant sample sizes.
I would be interested to know if any thought was given to the significance of the group size when it comes to focus groups. Has anyone evaluated this in a more controlled study with actual customers and then compared it to a live sample test? In many cases, we find this type of testing more financially practical. The concern is that using known customers/prospects can skew results if not managed correctly.
Kevin,
My experience with focus groups is very limited, so I can’t answer your question. I would be interested in hearing what others had to say, but I would think it is extremely difficult to attain true statistical significance in focus groups. Except when there are gaping differences in the response to two treatments, our required sample size for statistical significance is usually in the tens of thousands. I don’t see how you could replicate that in a focus group. And that’s when there are only two treatments with a simple A/B split. If you asked an open question in a focus group (instead of a “Which” question that you would ask during testing), I think it would be even harder, in fact I’d say impossible from a practical standpoint, to have a statistically significant sample size.
Also, keep in mind that there are validity threats beyond sample size. For example, with focus groups, you’re usually asking the participants hypothetical questions that may or may not correlate to real-world activity. With testing, you are observing actual real-world activity. What people say they do or think they do, and what they actually do can be vastly different.
Focus groups provide qualitative rather than quantitative information. Some of the questions used in a focus group may be driven by quantitative results, and some of the qualitative results from a focus group may guide quantitative testing, but quantitative and qualitative analysis are vastly different animals.
It’s hard to write a short post on statistical significance. I once looked up the underlying theory behind an A/B test calculator I had found on the web and definitely ended up in an endless rabbit hole in stats theory. I tend to frequent SEO Book’s A/B G-test Calc. Building your own on Excel is a great Friday afternoon project.
Good Morning Phillip,
I am trying to determine the sample size required to complete a workers’ compensation claims audit. My population consist of 560 claims. I want to determine whether or not the claims are adequately reserved to an 80% confidence level.
The claims were selected by place the claim numbers in alpha numeric order. The numbers represent individual client locations.
This may not be the correct forum for this question, or not enough information.
Thank you
Denise
Thanks for all of your informative articles. Can you recommend a simple calculator to use to assess the statistical validity of your results after the test runs?
Hi there,
This should help. https://www.meclabs.com/research/testing-tools