

The purpose of scientific research is to get as close as possible to the “truth” using limited resources available.
But, how close to truth do we actually get with our hypothesis and the data yielded from testing it?
Many scientists and statisticians have developed different validity methods in attempts to answer “How close is a hypothesis to the ‘truth?’”
And, as you would guess …
Different validity methods are also likely to produce different interpretations of data.
In today’s MarketingExperiments blog post, here are two common validation techniques. We showed examples of each using mock data to show you how these two methods can give different interpretations of the same test results.
Our goal here is to show marketers how selecting the best validity method for your testing efforts is essential to helping you answer the question “Is the treatment really better than the control in the long run?”
Aggregate validation
The aggregate method is a common method for calculating the validity of a hypothesis that is widely used.
In the aggregate method, all of the visitors and conversions on the page or site during the test are aggregated or “condensed” together for both the control and the treatment.
Next, their conversion rates are compared to each other to determine:
- The probability that there really is a difference between the performance of the control and experimental treatments based upon the samples collected to date.
- The statistical level of confidence (LOC is usually expressed in a percentage) of that probability.
And, the higher your LOC percentage is, the more certain or confident you can be your results are reliable and a true difference exists between your control and treatments.
One thing worth mentioning here is, at MECLABS, we recommend your test results reach validity with a 90% to 95% LOC or higher before you make any decisions based on those results.
Although some do forego this recommendation and make decisions based on results validated at an 80% LOC (or even lower), the caveat here is the unwritten industry standard is generally a 95% LOC or higher.
Now that we know the mechanics behind aggregate validation, let’s see it in action on some mock data.
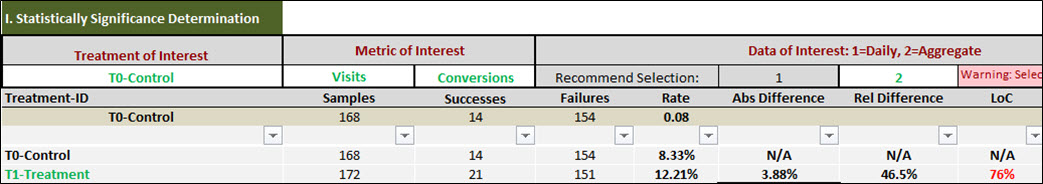
For this example, Iet’s say we ran a test with a control and treatment for seven days.
The control had 14 conversions out of 168 visitors and the treatment had 21 conversions out of 172 visitors.

Clearly, we can see the treatment had a higher conversion rate than the control.
But, is this difference significant enough for us to believe that treatment really is better than the control? Is it possible we are observing this difference by random chance?
The data suggests that it is not sufficient.
With only 168 to 172 visitors per treatment tested during the test, a relative difference of 46.5% over the control only yields validity at a level of confidence of 76%.
And, we would like to be at least 90% to 95% confident that the treatment is better because the higher the level of confidence also implies a lower likelihood of the observed difference during the test occurring by random chance.
Daily validation
The daily validation method compares the performance between a control and treatments on a daily basis. This allows you to analyze conversion based on daily performance versus aggregated. Please note, daily data is just one example of more directly measuring disparate data instead of clumping it into one big pile and looking at it once the test is over, assuming a normal distribution. Based on your traffic and level of conversion, it could make sense to measure hourly data, for example.
Now, let’s take a look at the daily validation method in action using the mock data from our test example above.

We can see from the graph the treatment outperformed the control every day during testing.
This window into the daily fluctuation provides visually compelling evidence that the treatment may actually be better than the control.

What’s also interesting here is this …
The absolute difference at the end of the tests is 3.88% and the relative difference is 46.5%
But, the level of confidence is 90% using the daily method as opposed to 76% for aggregate method.
Why?
The difference between them lies in how the two methods calculate statistical significance.
The aggregate method uses the magnitude of observed difference between the control and the treatments at the end of the test and the overall sample size used for each treatment.
The daily method, however, uses not only the magnitude of difference, but also the daily fluctuation observed throughout the test.
Understanding validity starts with understanding your options
My whole point here is to show you neither validity method is better or more accurate than the other.
The things that matter here most are circumstance and application.
So, the challenge is choosing the ideal validation method based on the circumstances of your testing.
Daily validation will give you insights into the magnitude of difference and the consistency at which the control and treatment performed and can also be used for validating smaller sample sizes.
The aggregate method can be used to validate tests where daily performance analysis is not practical or available.
Ultimately, the best approach to validity starts with understanding your testing circumstances and using the best option available those circumstances will allow.
Related Resources:
A/B Testing: Example of a good hypothesis
Online Marketing Tests: A data analyst’s view of balancing risk and reward
Conversion Rate Optimization: 3 factors to ensure your results are reliable
Do you have any resources that show the calculations behind the daily validation method? In particular getting the 90% LoC figure above?
Do you just clump together the data for each day, and define “success” for that day to be that the treatment being better, and then just calculate it using a regular 2-tailed z-test?
Thank you.
Francis,
Great question. The daily method uses t-test which is slightly different from z-test. It uses the success rate for each day for each treatment and compares their daily average success rates using the daily variation as the standard error estimates.
Thanks!
Thanks for the information Anuj.