We have all probably designed a test Webpage or offer email that we expected to dramatically outperform the control and been stunned when performance is poor or the results come back inconclusive.
What can you do to get significant improvements or learn in those situations where you actually cannot complete your test or where you have a validity issue—particularly a validity issue connected to the size of your sample?
When the differences in conversion between the control and the experimental treatments are so small that the test results don’t validate, is all that time and energy a total loss?
When we interpret test results, we can in fact arrive at a conclusion in two ways: induction, which is any form of reasoning in which the conclusion, though supported by the premises, does not follow from them necessarily or deduction, which is a process of reasoning in which a conclusion follows necessarily from the premises presented, so that the conclusion cannot be false if the premises are true.
In this clinic, we will use induction to scrutinize recent research findings to determine when it is possible to draw valid and valuable conclusions from tests that are not statistically valid.
Editor’s Note: We recently released the audio recording of our clinic on this topic. You can listen to a recording of this clinic here:
Landing Page Conversion: Getting Significant Improvements Even When You Cant Complete Your Tests
Case Study 1
Test Design
We conducted a 26-day experiment for a non-profit foundation that raises money for Alzheimer’s research.
The goal was to increase conversion and consequently increase the total donation amount.
Treatments
Which donation page will convert better?
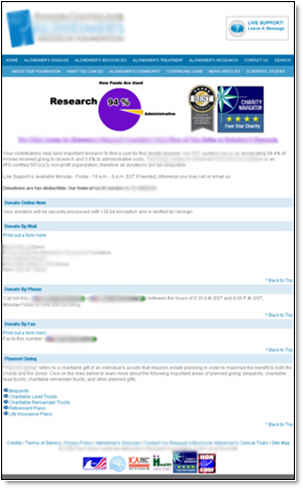
Control (two step process)

Treatment (one step process)
Results
| Page | Conversion |
|---|---|
| Control | 12.03% |
| Treatment | 3.03% |
| Difference | -3.33% |
What you need to understand: To gain validity with a relative difference of only 0.14%, we would have to run the test for over 4,000 days. Although the Control had a slightly better conversion rate, we CANNOT conclude that it was a better performing design.
However . . . the Treatment page had a substantially higher average donation.
| Treatment | Conversion |
|---|---|
| Control | $67 |
| Treatment | $237 |
| Percent Difference | 254% |
So, if we eliminate “outliers” by filtering out all donations beyond two standard deviations from the mean, can we then establish validity using dollar amounts?
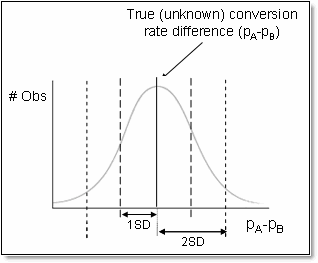
Validity
With outliers removed, the Treatment page still had a much higher average donation:
| Variable | Conversion | ± 2SD Adj. Mean |
|---|---|---|
| Control | $67 | $43 |
| Experimental | $237 | $118 |
| Percent Difference | 254% | 176% |
Question
Can we wisely substitute dollars for conversion rate as the success measurement?
For example:
| Samples (n) | %Traffic | Successes | Success Rate (p) | |
|---|---|---|---|---|
| Treatment 1 – Control ID1 Page | 1,000 | 50% | 43 | 4.30% |
| Treatment 2 – MEC Treatment Page ID2 | 1,000 | 50% | 118 | 11.80% |
| Summary Value | 2,000 | 100% | 161 | 2.74:1 |
| Success rate Standard Error | 0.012051017 | |||
| Success rate difference | 7.50% | |||
| Success rate test statistic | 6.223541364 | |||
| Sample Sufficiency Test | ||||
| Sample size is sufficient when it drops below d-Critical, E65.) (d-Critical) | ||||
| Standard Deviation of the difference in success proportions (xb-xa) | 1.205% | |||
| Statistical significance threshold for the difference in proportions (d) | 4.560% | |||
| Significant/Conclusive? | YES | |||
If we substitute average contribution per donor ($/donor) in place of the number of donors who contributed as a success measure, the validity test passes.
If we can establish validity using dollar amounts, then we might come to these conclusions:
- Placing the “94%-goes-to-research” image next to the donation amount may have reduced anxiety.
- Eliminating the radio buttons for the larger suggested donation amounts may have reduced intimidation or otherwise favorably affected average donation amount.
- Changing the font color or wording of the minimum allowable donation amount may have had a favorable effect on average donation amount.
 |
|
| Control | Treatment |
|---|---|
Unfortunately, it is NOT valid to simply substitute dollars for donors. Even so, deeper analysis of the data does appear to indicate a consistent pattern of higher contribution amounts for the Treatment-2 page than the Control page, and this insight is a central factor as we design the next round of tests.
Remember, these are just informed inductive conclusions.
- We can observe only that while the page changes did NOT substantially increase the conversion rate of arriving visitors to donors (i.e., % who donate), for the sample the average amount of money donated by each visitor/donor increased by more than 170%.
- Splitting the test period into multiple shorter time intervals reveals a similar and consistent pattern of higher contribution amounts for the Treatment 2 page.
- Producing a contribution-amount frequency distribution for the entire test period and also for the shorter test sub-intervals once again shows a consistent pattern, reducing the likelihood that the difference is due to outliers in time or contribution amount.
The Key methods for gaining insights for this case:
- We looked at characteristics beyond just the primary success measure of end-to-end conversion rate.
- Total dollars donated for each Treatment
- Average donation amount
- We looked for possible anomalies caused by outliers, which may have impacted the required sample size.
- We looked for patterns of behavior by analyzing subsets of the data and comparing them.
Case Study 2
Test Design
We conducted a 25-day experiment for an e-commerce site that sells wheelchairs and medical equipment to both businesses and consumers.
The objective was to increase the site’s rate of conversion-to-sale.
Which offer page will convert best?
| Control | Treatment 2 | Treatment 3 |
|---|---|---|
 |
 |
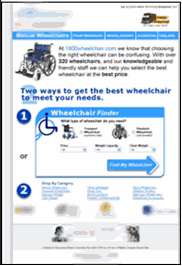 |
| Traditional “directory” style page | Focus on the most popular product | Product search/ “configurator” design |
Results
| Page | Conversion |
|---|---|
| Control | 2.71% |
| Treatment 2 | 3.06% |
| Treatment 3 | 2.85% |
| Diff. Between Treatment 2 and Control | 12.65% |
What you need to understand: To gain validity with a relative difference in conversion of only 0.35%, we would have to run the test for over 179 days. Although Treatment 2 had a slightly better conversion rate, we CANNOT yet conclude that it is a better performing design.
Since the test results were inconclusive, we should:
- Rerun the test.
- Run a new radical redesign variable cluster.
Remember, you are trying to challenge the Control with a Treatment that results in a significant (hopefully positive) difference.
Just a second . . .
Before we simply discard the data and write off the test as a failure, is there ANYTHING of value we can learn from this test?
Might we gain some insights from attributes beyond simply the overall test-long conversion rate?
Revenue per order
Both with and without outliers, the Control page had a much higher average revenue per order than the other two pages–especially the page with the highest conversion rate in the test sample.
| Page | Conversion |
|---|---|
| Control | $237.23 |
| Treatment 2 | $128.19 |
| Treatment 3 | $203.12 |
| Diff. Between Treatment 2 and Control | -45.96% |
| Diff. Between Treatment 3 and Control | -14.38% |
Key point: Supplemental analysis through removal of outliers does not change the level of test validity, but rather offers additional insights about the test subjects and the testing conditions.
Question
How could treatments with such similar conversion rates vary so widely in revenue per order?
When we analyzed the test results on a product level, we noticed two subtle but very important patterns:
- The featured product was one of the top converters for the Control page.
- The Control page sold 175% more accessories than the Treatment pages. This was the biggest contributor to the wide gap in average order price.
Observations and Insights for follow-on testing:
- Featured items were a key point of sale for the Control page.
- We may want to consider testing more expensive items on the Control page.
- The presence of product accessories on the landing page increased overall accessory sales volume for the site.
- The first accessory on the landing page, the “foldable drink holder,” had the highest sales volume.
- We should consider testing other accessories here to determine the one with the maximum impact.
- We should test the impact of including the related accessories along with all major product categories on the page.
The key methods for gaining insights for this case:
We looked at characteristics beyond just the primary success measure of overall conversion-to-sale.
- Average revenue per order for each Treatment.
- Mix of products ordered for each page.
We analyzed the amount of variation in each variable by looking at measures of variance. Greater variance translates to need for larger samples. It is also an indicator of possible hidden sources of difference during the test period
- Different types of test subjects mixed.
- Changes in performance over time.
We looked at the page performance data for each of the attributes measured and looked for connections between page design attributes and performance.
What kinds of circumstances would support this behavior? What inductive insight can we gain?
Case Study 3
Test Design
If you were in our last clinic on validation, you’ll remember the case study in which a test validated the first week, but by the end of the 2nd week, it did not.
What if the test had simply run both weeks and at the end of the test period, it did not validate?
| Page | Bounce Rate |
|---|---|
| Control | 21.38% |
| Treatment 1 | 19.94% |
| Treatment 2 | 16.88% |
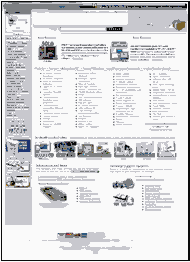
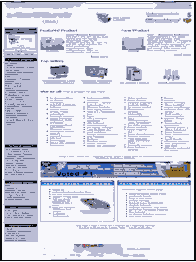
| Control | Treatment 1 | Treatment 2 |
|---|---|---|
 |
 |
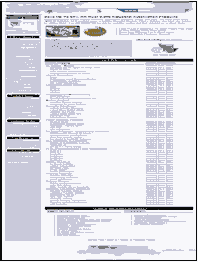 |
| Baseline | Product-oriented format | Directory format |
Stratifying the data
One way of gaining additional insights into test data is to “disaggregate” it by different attributes.
Here, if you split the data into two distinct weeks, you see that the picture looks quite different:
| Page | Week 1 | Week 2 | Difference |
|---|---|---|---|
| Control | 22.6% | 20.2% | -10.8% |
| Treatment 1 | 20.2% | 19.7% | -2.3% |
| Treatment 2 | 12.9% | 20.7% | 60.5% |
| Validates alone. | Fails to validate, alone & at two weeks. |
The Control and Treatment 1 pages performed very consistently throughout the two-week test period.
But the Treatment 2 page bounce rate changed dramatically, soaring from 12.9% in the first week to 20.7% in week 2.
The cause of this change is still under investigation.
What can cause performance differences through time?
Seasonality:
- Weekdays vs. weekends
- Time of day
Validity threats:
- History Effects
- Instrumentation Effects
- Selection Effects
Questions:
Are there recognizable patterns when the relative performance of the Treatments varies significantly? Could identifying them result in validation for a specific set of conditions?
Were there any “interesting” (i.e., test-threatening) events during the test period?
Unless you stratify your data, you will not know.
The key methods for gaining insights for this case:
- We analyzed the amount of variation in the test data and found it to be high. This, once again, suggests the possibility of hidden sources of difference during the test period.
- Different types of test subjects mixed.
- Changes in performance over time.
- We “disaggregated” the data and found that:
- A dramatic change in the performance of just one of the three Treatments occurred from the first week to the second.
- At the same time, the average time-on-site for first time (vs. returning) visitors declined by more than 40%.
Case Study 4
Student Submitted Question
Test Design
We received an email from a long-time student with a question that dealt specifically with the interpretation of recent test results.
The student wanted help in interpreting the results of a four-treatment test that showed a “significant” difference among the pages tested but wanted to know whether they could establish a “winner.”
Which of the four rotations of graphics on the landing page will increase click-through?
Treatments
- Red car with the customary square “Start” box.
- Family in car.
- Men falling off a log.
- Red car with a rounded “Start” box.
Results
We found the following:
| Page | CTR |
|---|---|
| Red car—Square | 17.79% |
| Family in car | 17.84% |
| Men falling off log | 17.52% |
| Red car—Round | 17.01% |
What you need to understand: The sample size was big enough to say that there is a significant difference among the Click-Through Rates (CTR) performance of the four Treatments. However, if the first Treatment is the Control, then the sample is NOT big enough to say that the 2nd (“Family in car”) Treatment is significantly better than the Control. In fact, it would take more than 5 years to accumulate a sufficient sample to conclude this with a 95% level of confidence.
Test Interpretation
This means that we cannot conclusively say that any of the first three Treatments are “better” than another, using the data the student has collected to date. But, taking a closer look at Treatment 4 reveals a small but very important difference between it and the other Treatments.
 |
 |
| Start box for Treatments 1, 2, and 3 |
Start box for Treatment 4 |
Presuming that the (red car) image is the same one between Treatment 1 and Treatment 4, then the shape of the start box (rounded vs. square) caused a significant drop in quote-starts.
So, perhaps the square start box is superior.
You may gain other, similar insights for subsequent testing through this form of analysis.
Research Findings: Observations and Principles
Here are some principles and methods for judiciously gaining insights from an invalid test.
- “The Null Conclusion.” First, record and make note of the fact that changing the variables in the ways that you did had little effect on performance. This may be the single most valuable insight you can gain. In subsequent tests, you should consider testing different variables or experimenting with more “radical” changes.
- Look for patterns of performance among treatments that share similar attributes, even those that identify things that you definitely DON’T want to do, such as those in the insurance quotes case study.
- Compare secondary or non-test-design measures of success, such as dollars in the donation site case study.
- Look for connections between treatment attributes and patterns of purchase behavior, such as the big difference in featured accessories sales vs. others in the medical company case study.
- Look for patterns of “seasonal” performance difference among the treatments based upon time; such as, Does one version perform much better on weekends vs. weekdays? How about morning vs. afternoon or nighttime? These are all examples of “seasonality.”
- Look for validity threats. When test results are surprising, look for hidden sources of difference. Look to ensure that your metrics are accurate and you have not suffered from History or Instrumentation effects. (See Test Validity brief for more on this subject.)
- Keep careful historical records of your tests and test results. You may be able to achieve conclusive results in an abbreviated time by exploiting statistical methods intended to consider prior knowledge or test results. MarketingExperiments is currently conducting ongoing research on the use of Bayesian methodology and other methods for improving the effectiveness and reducing the cost of testing.
Remember, it is more important to conduct a useful test than a successful one.
To learn more about our key methods for gaining insight into invalid or incomplete tests, consider enrolling in the MarketingExperiments Professional Certification course in Online Testing.
Related MarketingExperiments Reports:
- Optimization Testing Tested: Validity Threats–Beyond Sample Size
- Landing Page Optimization—Big Conversion Gains from a Little Scissors and Grease?
- Landing Page Optimization Tested—How to Create “Sticky” Landing Pages
- Optimizing Landing Pages
As part of our research, we have prepared a review of the best Internet resources on this topic.
Rating System
These sites were rated for usefulness and clarity, but alas, the rating is purely subjective.
* = Decent | ** = Good | *** = Excellent | **** = Indispensable
- How To Measure the Success of Your Web App **
- Learning to Classify Incomplete Examples **
- Combining Dependent Tests with Incomplete Repeated Measurements **
- Validity (statistics) **
- Populations, Samples, and Validity **
Credits:
Editor(s) — Frank Green
Writer(s) — Bob Kemper
Peg Davis
Contributor(s) — Jeremy Brookins
Peg Davis
Jimmy Ellis
Bob Kemper
Flint McGlaughlin
HTML Designer — Cliff Rainer
Holly Hicks


